Cree vs Immigrants from Dominican Republic 8th Grade

COMPARE

Cree
Race
Ancestry
AfghanAfricanAlaska NativeAlaskan AthabascanAlbanianAleutAlsatianAmericanApacheArabArapahoArgentineanArmenianAssyrian/Chaldean/SyriacAustralianAustrianBahamianBangladeshiBarbadianBasqueBelgianBelizeanBermudanBhutaneseBlackfeetBolivianBrazilianBritishBritish West IndianBulgarianBurmeseCajunCambodianCanadianCape VerdeanCarpatho RusynCelticCentral AmericanCentral American IndianCherokeeCheyenneChickasawChileanChineseChippewaChoctawColombianColvilleComancheCosta RicanCreeCreekCroatianCrowCubanCypriotCzechCzechoslovakianDanishDelawareDominicanDutchDutch West IndianEastern EuropeanEcuadorianEgyptianEnglishEstonianEthiopianEuropeanFijianFilipinoFinnishFrenchFrench American IndianFrench CanadianGermanGerman RussianGhanaianGreekGuamanian/ChamorroGuatemalanGuyaneseHaitianHmongHonduranHopiHoumaHungarianIcelanderIndian (Asian)IndonesianInupiatIranianIraqiIrishIroquoisIsraeliItalianJamaicanJapaneseJordanianKenyanKiowaKoreanLaotianLatvianLebaneseLiberianLithuanianLumbeeLuxembourgerMacedonianMalaysianMalteseMarshalleseMenomineeMexicanMexican American IndianMongolianMoroccanNative HawaiianNavajoNepaleseNew ZealanderNicaraguanNigerianNorthern EuropeanNorwegianOkinawanOsageOttawaPaiutePakistaniPalestinianPanamanianParaguayanPennsylvania GermanPeruvianPimaPolishPortuguesePotawatomiPuebloPuerto RicanPuget Sound SalishRomanianRussianSalvadoranSamoanScandinavianScotch-IrishScottishSeminoleSenegaleseSerbianShoshoneSierra LeoneanSiouxSlavicSlovakSloveneSomaliSouth AfricanSouth AmericanSouth American IndianSoviet UnionSpaniardSpanishSpanish AmericanSpanish American IndianSri LankanSubsaharan AfricanSudaneseSwedishSwissSyrianTaiwaneseThaiTlingit-HaidaTohono O'OdhamTonganTrinidadian and TobagonianTsimshianTurkishU.S. Virgin IslanderUgandanUkrainianUruguayanUteVenezuelanVietnameseWelshWest IndianYakamaYaquiYugoslavianYumanYup'ikZimbabwean
Immigration
NonimmigrantsImmigrantsAfghanistanAfricaAlbaniaArgentinaArmeniaAsiaAustraliaAustriaBahamasBangladeshBarbadosBelarusBelgiumBelizeBoliviaBosnia and HerzegovinaBrazilBulgariaBurma/MyanmarCabo VerdeCambodiaCameroonCanadaCaribbeanCentral AmericaChileChinaColombiaCongoCosta RicaCroatiaCubaCzechoslovakiaDenmarkDominicaEastern AfricaEastern AsiaEastern EuropeEcuadorEgyptEl SalvadorEnglandEritreaEthiopiaEuropeFijiFranceGermanyGhanaGreeceGrenadaGuatemalaGuyanaHaitiHondurasHong KongHungaryIndiaIndonesiaIranIraqIrelandIsraelItalyJamaicaJapanJordanKazakhstanKenyaKoreaKuwaitLaosLatin AmericaLatviaLebanonLiberiaLithuaniaMalaysiaMexicoMicronesiaMiddle AfricaMoldovaMoroccoNepalNetherlandsNicaraguaNigeriaNorth AmericaNorth MacedoniaNorthern AfricaNorthern EuropeNorwayOceaniaPakistanPanamaPeruPhilippinesPolandPortugalRomaniaRussiaSaudi ArabiaScotlandSenegalSerbiaSierra LeoneSingaporeSomaliaSouth AfricaSouth AmericaSouth Central AsiaSouth Eastern AsiaSouthern EuropeSpainSri LankaSt. Vincent and the GrenadinesSudanSwedenSwitzerlandSyriaTaiwanThailandTrinidad and TobagoTurkeyUgandaUkraineUruguayUzbekistanVenezuelaVietnamWest IndiesWestern AfricaWestern AsiaWestern EuropeYemenZaireZimbabweAzores
Immigrants from Dominican Republic
Race
Ancestry
AfghanAfricanAlaska NativeAlaskan AthabascanAlbanianAleutAlsatianAmericanApacheArabArapahoArgentineanArmenianAssyrian/Chaldean/SyriacAustralianAustrianBahamianBangladeshiBarbadianBasqueBelgianBelizeanBermudanBhutaneseBlackfeetBolivianBrazilianBritishBritish West IndianBulgarianBurmeseCajunCambodianCanadianCape VerdeanCarpatho RusynCelticCentral AmericanCentral American IndianCherokeeCheyenneChickasawChileanChineseChippewaChoctawColombianColvilleComancheCosta RicanCreekCroatianCrowCubanCypriotCzechCzechoslovakianDanishDelawareDominicanDutchDutch West IndianEastern EuropeanEcuadorianEgyptianEnglishEstonianEthiopianEuropeanFijianFilipinoFinnishFrenchFrench American IndianFrench CanadianGermanGerman RussianGhanaianGreekGuamanian/ChamorroGuatemalanGuyaneseHaitianHmongHonduranHopiHoumaHungarianIcelanderIndian (Asian)IndonesianInupiatIranianIraqiIrishIroquoisIsraeliItalianJamaicanJapaneseJordanianKenyanKiowaKoreanLaotianLatvianLebaneseLiberianLithuanianLumbeeLuxembourgerMacedonianMalaysianMalteseMarshalleseMenomineeMexicanMexican American IndianMongolianMoroccanNative HawaiianNavajoNepaleseNew ZealanderNicaraguanNigerianNorthern EuropeanNorwegianOkinawanOsageOttawaPaiutePakistaniPalestinianPanamanianParaguayanPennsylvania GermanPeruvianPimaPolishPortuguesePotawatomiPuebloPuerto RicanPuget Sound SalishRomanianRussianSalvadoranSamoanScandinavianScotch-IrishScottishSeminoleSenegaleseSerbianShoshoneSierra LeoneanSiouxSlavicSlovakSloveneSomaliSouth AfricanSouth AmericanSouth American IndianSoviet UnionSpaniardSpanishSpanish AmericanSpanish American IndianSri LankanSubsaharan AfricanSudaneseSwedishSwissSyrianTaiwaneseThaiTlingit-HaidaTohono O'OdhamTonganTrinidadian and TobagonianTsimshianTurkishU.S. Virgin IslanderUgandanUkrainianUruguayanUteVenezuelanVietnameseWelshWest IndianYakamaYaquiYugoslavianYumanYup'ikZimbabwean
Immigration
NonimmigrantsImmigrantsAfghanistanAfricaAlbaniaArgentinaArmeniaAsiaAustraliaAustriaBahamasBangladeshBarbadosBelarusBelgiumBelizeBoliviaBosnia and HerzegovinaBrazilBulgariaBurma/MyanmarCabo VerdeCambodiaCameroonCanadaCaribbeanCentral AmericaChileChinaColombiaCongoCosta RicaCroatiaCubaCzechoslovakiaDenmarkDominicaDominican RepublicEastern AfricaEastern AsiaEastern EuropeEcuadorEgyptEl SalvadorEnglandEritreaEthiopiaEuropeFijiFranceGermanyGhanaGreeceGrenadaGuatemalaGuyanaHaitiHondurasHong KongHungaryIndiaIndonesiaIranIraqIrelandIsraelItalyJamaicaJapanJordanKazakhstanKenyaKoreaKuwaitLaosLatin AmericaLatviaLebanonLiberiaLithuaniaMalaysiaMexicoMicronesiaMiddle AfricaMoldovaMoroccoNepalNetherlandsNicaraguaNigeriaNorth AmericaNorth MacedoniaNorthern AfricaNorthern EuropeNorwayOceaniaPakistanPanamaPeruPhilippinesPolandPortugalRomaniaRussiaSaudi ArabiaScotlandSenegalSerbiaSierra LeoneSingaporeSomaliaSouth AfricaSouth AmericaSouth Central AsiaSouth Eastern AsiaSouthern EuropeSpainSri LankaSt. Vincent and the GrenadinesSudanSwedenSwitzerlandSyriaTaiwanThailandTrinidad and TobagoTurkeyUgandaUkraineUruguayUzbekistanVenezuelaVietnamWest IndiesWestern AfricaWestern AsiaWestern EuropeYemenZaireZimbabweAzores
8th Grade
Income
Poverty
Unemployment
Labor Participation
Family Structure
Vehicle Availability
Education Level
Disability

8th Grade Comparison

Cree

Immigrants from Dominican Republic

Exceptional
Tragic
96.4%
8TH GRADE
98.6/ 100
METRIC RATING
99th/ 347
METRIC RANK
92.3%
8TH GRADE
0.0/ 100
METRIC RATING
332nd/ 347
METRIC RANK

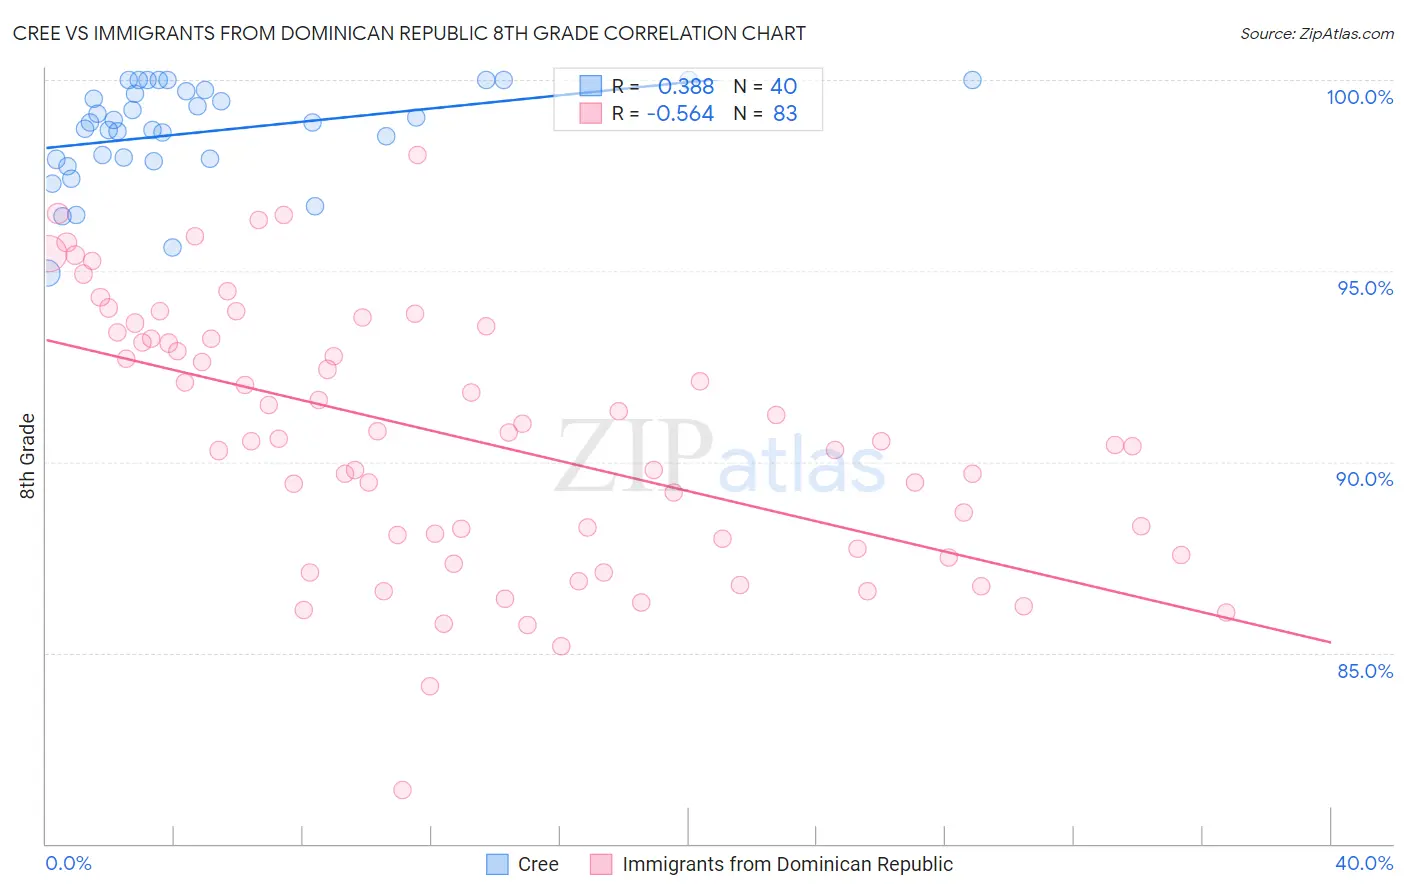
Cree vs Immigrants from Dominican Republic 8th Grade Correlation Chart

The statistical analysis conducted on geographies consisting of 76,204,399 people shows a mild positive correlation between the proportion of Cree and percentage of population with at least 8th grade education in the United States with a correlation coefficient (R) of 0.388 and weighted average of 96.4%. Similarly, the statistical analysis conducted on geographies consisting of 275,144,349 people shows a substantial negative correlation between the proportion of Immigrants from Dominican Republic and percentage of population with at least 8th grade education in the United States with a correlation coefficient (R) of -0.564 and weighted average of 92.3%, a difference of 4.4%.
Cree vs Immigrants from Dominican Republic 8th Grade

8th Grade Correlation Summary

MeasurementCreeImmigrants from Dominican Republic
Minimum94.9%81.4%
Maximum100.0%98.1%
Range5.1%16.6%
Mean98.6%90.6%
Median98.9%90.5%
Interquartile 25% (IQ1)97.9%87.7%
Interquartile 75% (IQ3)99.7%93.2%
Interquartile Range (IQR)1.8%5.5%
Standard Deviation (Sample)1.3%3.4%
Standard Deviation (Population)1.3%3.4%

Similar Demographics by 8th Grade

Demographics Similar to Cree by 8th Grade

In terms of 8th grade, the demographic groups most similar to Cree are Osage (96.4%, a difference of 0.0%), Immigrants from Germany (96.4%, a difference of 0.0%), Potawatomi (96.4%, a difference of 0.010%), Immigrants from Czechoslovakia (96.4%, a difference of 0.010%), and Immigrants from Singapore (96.4%, a difference of 0.020%).
DemographicsRating | Rank8th Grade
Menominee
98.9
/100
|
#92
Exceptional
96.4%
Immigrants | Denmark
98.8
/100
|
#93
Exceptional
96.4%
Immigrants | Singapore
98.8
/100
|
#94
Exceptional
96.4%
German Russians
98.8
/100
|
#95
Exceptional
96.4%
Potawatomi
98.7
/100
|
#96
Exceptional
96.4%
Osage
98.7
/100
|
#97
Exceptional
96.4%
Immigrants | Germany
98.7
/100
|
#98
Exceptional
96.4%
Cree
98.6
/100
|
#99
Exceptional
96.4%
Immigrants | Czechoslovakia
98.6
/100
|
#100
Exceptional
96.4%
Bhutanese
98.2
/100
|
#101
Exceptional
96.4%
South Africans
98.2
/100
|
#102
Exceptional
96.4%
Immigrants | Saudi Arabia
98.0
/100
|
#103
Exceptional
96.3%
Kiowa
98.0
/100
|
#104
Exceptional
96.3%
Immigrants | North Macedonia
98.0
/100
|
#105
Exceptional
96.3%
Okinawans
98.0
/100
|
#106
Exceptional
96.3%

Demographics Similar to Immigrants from Dominican Republic by 8th Grade

In terms of 8th grade, the demographic groups most similar to Immigrants from Dominican Republic are Immigrants from Armenia (92.3%, a difference of 0.020%), Honduran (92.3%, a difference of 0.020%), Immigrants from Cabo Verde (92.4%, a difference of 0.11%), Hispanic or Latino (92.2%, a difference of 0.11%), and Immigrants from Nicaragua (92.5%, a difference of 0.17%).
DemographicsRating | Rank8th Grade
Dominicans
0.0
/100
|
#325
Tragic
92.8%
Central American Indians
0.0
/100
|
#326
Tragic
92.7%
Immigrants | Azores
0.0
/100
|
#327
Tragic
92.5%
Immigrants | Nicaragua
0.0
/100
|
#328
Tragic
92.5%
Immigrants | Cabo Verde
0.0
/100
|
#329
Tragic
92.4%
Immigrants | Armenia
0.0
/100
|
#330
Tragic
92.3%
Hondurans
0.0
/100
|
#331
Tragic
92.3%
Immigrants | Dominican Republic
0.0
/100
|
#332
Tragic
92.3%
Hispanics or Latinos
0.0
/100
|
#333
Tragic
92.2%
Immigrants | Yemen
0.0
/100
|
#334
Tragic
92.1%
Mexican American Indians
0.0
/100
|
#335
Tragic
92.1%
Immigrants | Honduras
0.0
/100
|
#336
Tragic
91.9%
Immigrants | Latin America
0.0
/100
|
#337
Tragic
91.7%
Central Americans
0.0
/100
|
#338
Tragic
91.6%
Mexicans
0.0
/100
|
#339
Tragic
91.4%