Costa Rican vs Immigrants from Scotland Kindergarten

COMPARE

Costa Rican
Race
Ancestry
AfghanAfricanAlaska NativeAlaskan AthabascanAlbanianAleutAlsatianAmericanApacheArabArapahoArgentineanArmenianAssyrian/Chaldean/SyriacAustralianAustrianBahamianBangladeshiBarbadianBasqueBelgianBelizeanBermudanBhutaneseBlackfeetBolivianBrazilianBritishBritish West IndianBulgarianBurmeseCajunCambodianCanadianCape VerdeanCarpatho RusynCelticCentral AmericanCentral American IndianCherokeeCheyenneChickasawChileanChineseChippewaChoctawColombianColvilleComancheCosta RicanCreeCreekCroatianCrowCubanCypriotCzechCzechoslovakianDanishDelawareDominicanDutchDutch West IndianEastern EuropeanEcuadorianEgyptianEnglishEstonianEthiopianEuropeanFijianFilipinoFinnishFrenchFrench American IndianFrench CanadianGermanGerman RussianGhanaianGreekGuamanian/ChamorroGuatemalanGuyaneseHaitianHmongHonduranHopiHoumaHungarianIcelanderIndian (Asian)IndonesianInupiatIranianIraqiIrishIroquoisIsraeliItalianJamaicanJapaneseJordanianKenyanKiowaKoreanLaotianLatvianLebaneseLiberianLithuanianLumbeeLuxembourgerMacedonianMalaysianMalteseMarshalleseMenomineeMexicanMexican American IndianMongolianMoroccanNative HawaiianNavajoNepaleseNew ZealanderNicaraguanNigerianNorthern EuropeanNorwegianOkinawanOsageOttawaPaiutePakistaniPalestinianPanamanianParaguayanPennsylvania GermanPeruvianPimaPolishPortuguesePotawatomiPuebloPuerto RicanPuget Sound SalishRomanianRussianSalvadoranSamoanScandinavianScotch-IrishScottishSeminoleSenegaleseSerbianShoshoneSierra LeoneanSiouxSlavicSlovakSloveneSomaliSouth AfricanSouth AmericanSouth American IndianSoviet UnionSpaniardSpanishSpanish AmericanSpanish American IndianSri LankanSubsaharan AfricanSudaneseSwedishSwissSyrianTaiwaneseThaiTlingit-HaidaTohono O'OdhamTonganTrinidadian and TobagonianTsimshianTurkishU.S. Virgin IslanderUgandanUkrainianUruguayanUteVenezuelanVietnameseWelshWest IndianYakamaYaquiYugoslavianYumanYup'ikZimbabwean
Immigration
NonimmigrantsImmigrantsAfghanistanAfricaAlbaniaArgentinaArmeniaAsiaAustraliaAustriaBahamasBangladeshBarbadosBelarusBelgiumBelizeBoliviaBosnia and HerzegovinaBrazilBulgariaBurma/MyanmarCabo VerdeCambodiaCameroonCanadaCaribbeanCentral AmericaChileChinaColombiaCongoCosta RicaCroatiaCubaCzechoslovakiaDenmarkDominicaDominican RepublicEastern AfricaEastern AsiaEastern EuropeEcuadorEgyptEl SalvadorEnglandEritreaEthiopiaEuropeFijiFranceGermanyGhanaGreeceGrenadaGuatemalaGuyanaHaitiHondurasHong KongHungaryIndiaIndonesiaIranIraqIrelandIsraelItalyJamaicaJapanJordanKazakhstanKenyaKoreaKuwaitLaosLatin AmericaLatviaLebanonLiberiaLithuaniaMalaysiaMexicoMicronesiaMiddle AfricaMoldovaMoroccoNepalNetherlandsNicaraguaNigeriaNorth AmericaNorth MacedoniaNorthern AfricaNorthern EuropeNorwayOceaniaPakistanPanamaPeruPhilippinesPolandPortugalRomaniaRussiaSaudi ArabiaSenegalSerbiaSierra LeoneSingaporeSomaliaSouth AfricaSouth AmericaSouth Central AsiaSouth Eastern AsiaSouthern EuropeSpainSri LankaSt. Vincent and the GrenadinesSudanSwedenSwitzerlandSyriaTaiwanThailandTrinidad and TobagoTurkeyUgandaUkraineUruguayUzbekistanVenezuelaVietnamWest IndiesWestern AfricaWestern AsiaWestern EuropeYemenZaireZimbabweAzores
Immigrants from Scotland
Race
Ancestry
AfghanAfricanAlaska NativeAlaskan AthabascanAlbanianAleutAlsatianAmericanApacheArabArapahoArgentineanArmenianAssyrian/Chaldean/SyriacAustralianAustrianBahamianBangladeshiBarbadianBasqueBelgianBelizeanBermudanBhutaneseBlackfeetBolivianBrazilianBritishBritish West IndianBulgarianBurmeseCajunCambodianCanadianCape VerdeanCarpatho RusynCelticCentral AmericanCentral American IndianCherokeeCheyenneChickasawChileanChineseChippewaChoctawColombianColvilleComancheCreeCreekCroatianCrowCubanCypriotCzechCzechoslovakianDanishDelawareDominicanDutchDutch West IndianEastern EuropeanEcuadorianEgyptianEnglishEstonianEthiopianEuropeanFijianFilipinoFinnishFrenchFrench American IndianFrench CanadianGermanGerman RussianGhanaianGreekGuamanian/ChamorroGuatemalanGuyaneseHaitianHmongHonduranHopiHoumaHungarianIcelanderIndian (Asian)IndonesianInupiatIranianIraqiIrishIroquoisIsraeliItalianJamaicanJapaneseJordanianKenyanKiowaKoreanLaotianLatvianLebaneseLiberianLithuanianLumbeeLuxembourgerMacedonianMalaysianMalteseMarshalleseMenomineeMexicanMexican American IndianMongolianMoroccanNative HawaiianNavajoNepaleseNew ZealanderNicaraguanNigerianNorthern EuropeanNorwegianOkinawanOsageOttawaPaiutePakistaniPalestinianPanamanianParaguayanPennsylvania GermanPeruvianPimaPolishPortuguesePotawatomiPuebloPuerto RicanPuget Sound SalishRomanianRussianSalvadoranSamoanScandinavianScotch-IrishScottishSeminoleSenegaleseSerbianShoshoneSierra LeoneanSiouxSlavicSlovakSloveneSomaliSouth AfricanSouth AmericanSouth American IndianSoviet UnionSpaniardSpanishSpanish AmericanSpanish American IndianSri LankanSubsaharan AfricanSudaneseSwedishSwissSyrianTaiwaneseThaiTlingit-HaidaTohono O'OdhamTonganTrinidadian and TobagonianTsimshianTurkishU.S. Virgin IslanderUgandanUkrainianUruguayanUteVenezuelanVietnameseWelshWest IndianYakamaYaquiYugoslavianYumanYup'ikZimbabwean
Immigration
NonimmigrantsImmigrantsAfghanistanAfricaAlbaniaArgentinaArmeniaAsiaAustraliaAustriaBahamasBangladeshBarbadosBelarusBelgiumBelizeBoliviaBosnia and HerzegovinaBrazilBulgariaBurma/MyanmarCabo VerdeCambodiaCameroonCanadaCaribbeanCentral AmericaChileChinaColombiaCongoCosta RicaCroatiaCubaCzechoslovakiaDenmarkDominicaDominican RepublicEastern AfricaEastern AsiaEastern EuropeEcuadorEgyptEl SalvadorEnglandEritreaEthiopiaEuropeFijiFranceGermanyGhanaGreeceGrenadaGuatemalaGuyanaHaitiHondurasHong KongHungaryIndiaIndonesiaIranIraqIrelandIsraelItalyJamaicaJapanJordanKazakhstanKenyaKoreaKuwaitLaosLatin AmericaLatviaLebanonLiberiaLithuaniaMalaysiaMexicoMicronesiaMiddle AfricaMoldovaMoroccoNepalNetherlandsNicaraguaNigeriaNorth AmericaNorth MacedoniaNorthern AfricaNorthern EuropeNorwayOceaniaPakistanPanamaPeruPhilippinesPolandPortugalRomaniaRussiaSaudi ArabiaScotlandSenegalSerbiaSierra LeoneSingaporeSomaliaSouth AfricaSouth AmericaSouth Central AsiaSouth Eastern AsiaSouthern EuropeSpainSri LankaSt. Vincent and the GrenadinesSudanSwedenSwitzerlandSyriaTaiwanThailandTrinidad and TobagoTurkeyUgandaUkraineUruguayUzbekistanVenezuelaVietnamWest IndiesWestern AfricaWestern AsiaWestern EuropeYemenZaireZimbabweAzores
Kindergarten
Income
Poverty
Unemployment
Labor Participation
Family Structure
Vehicle Availability
Education Level
Disability

Kindergarten Comparison

Costa Ricans

Immigrants from Scotland

Poor
Exceptional
97.8%
KINDERGARTEN
11.6/ 100
METRIC RATING
209th/ 347
METRIC RANK
98.4%
KINDERGARTEN
99.8/ 100
METRIC RATING
55th/ 347
METRIC RANK

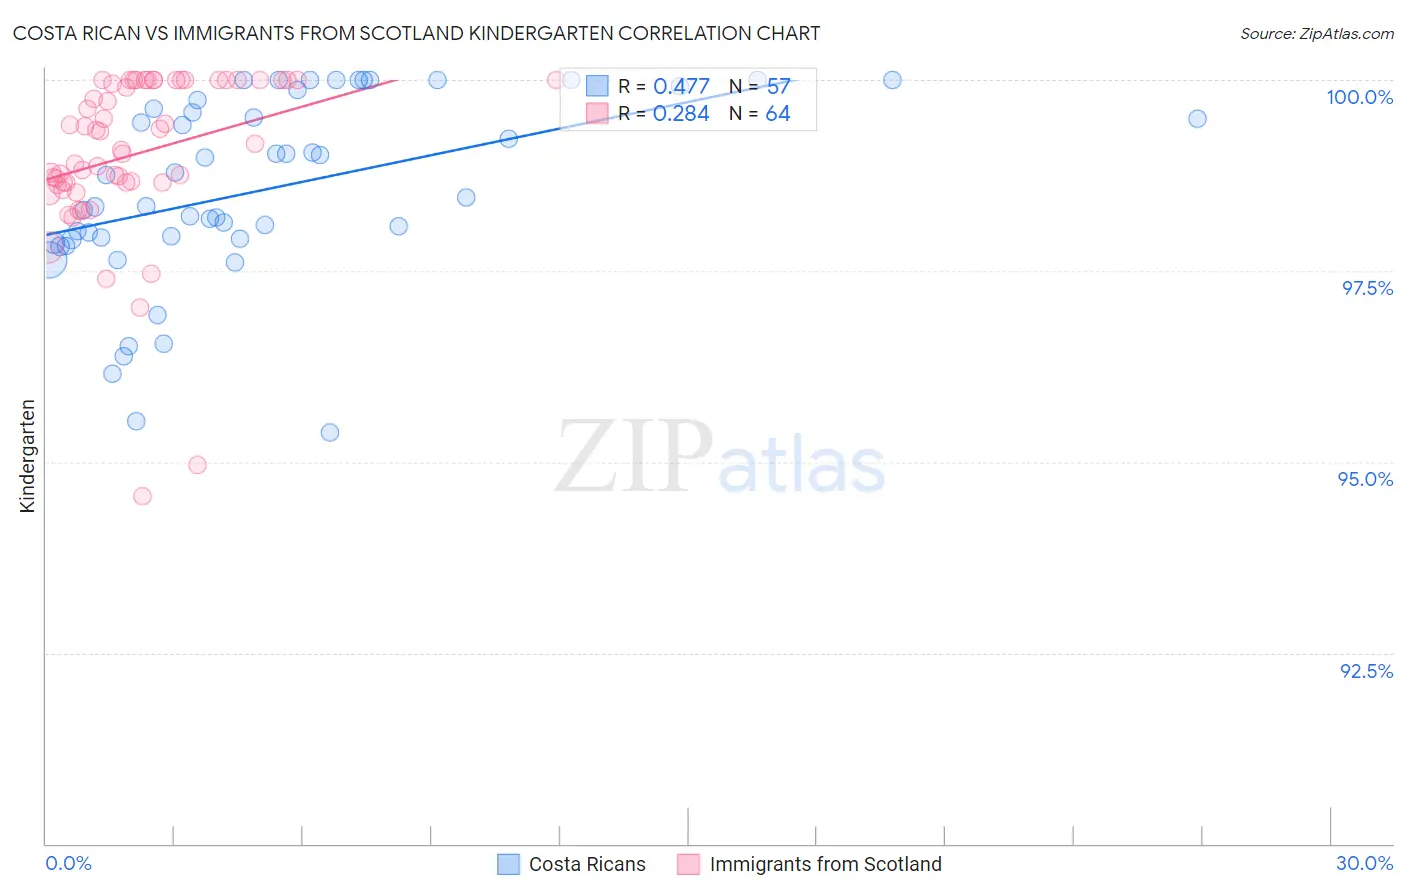
Costa Rican vs Immigrants from Scotland Kindergarten Correlation Chart

The statistical analysis conducted on geographies consisting of 253,599,979 people shows a moderate positive correlation between the proportion of Costa Ricans and percentage of population with at least kindergarten education in the United States with a correlation coefficient (R) of 0.477 and weighted average of 97.8%. Similarly, the statistical analysis conducted on geographies consisting of 196,398,887 people shows a weak positive correlation between the proportion of Immigrants from Scotland and percentage of population with at least kindergarten education in the United States with a correlation coefficient (R) of 0.284 and weighted average of 98.4%, a difference of 0.63%.
Costa Rican vs Immigrants from Scotland Kindergarten

Kindergarten Correlation Summary

MeasurementCosta RicanImmigrants from Scotland
Minimum95.4%94.6%
Maximum100.0%100.0%
Range4.6%5.4%
Mean98.6%99.0%
Median98.5%99.1%
Interquartile 25% (IQ1)97.9%98.7%
Interquartile 75% (IQ3)99.7%100.0%
Interquartile Range (IQR)1.8%1.3%
Standard Deviation (Sample)1.2%1.1%
Standard Deviation (Population)1.2%1.1%

Similar Demographics by Kindergarten

Demographics Similar to Costa Ricans by Kindergarten

In terms of kindergarten, the demographic groups most similar to Costa Ricans are Immigrants from Northern Africa (97.8%, a difference of 0.0%), Immigrants from Oceania (97.8%, a difference of 0.0%), Laotian (97.8%, a difference of 0.010%), Moroccan (97.8%, a difference of 0.020%), and Immigrants from Albania (97.8%, a difference of 0.030%).
DemographicsRating | RankKindergarten
Immigrants | Ukraine
19.1
/100
|
#202
Poor
97.8%
Immigrants | Uganda
18.8
/100
|
#203
Poor
97.8%
Immigrants | Chile
18.1
/100
|
#204
Poor
97.8%
Immigrants | Southern Europe
18.0
/100
|
#205
Poor
97.8%
Immigrants | Albania
16.4
/100
|
#206
Poor
97.8%
Africans
16.1
/100
|
#207
Poor
97.8%
Immigrants | Northern Africa
12.0
/100
|
#208
Poor
97.8%
Costa Ricans
11.6
/100
|
#209
Poor
97.8%
Immigrants | Oceania
11.1
/100
|
#210
Poor
97.8%
Laotians
10.5
/100
|
#211
Poor
97.8%
Moroccans
8.9
/100
|
#212
Tragic
97.8%
South American Indians
7.7
/100
|
#213
Tragic
97.8%
Uruguayans
7.5
/100
|
#214
Tragic
97.8%
Immigrants | Bahamas
7.4
/100
|
#215
Tragic
97.8%
Samoans
6.9
/100
|
#216
Tragic
97.8%

Demographics Similar to Immigrants from Scotland by Kindergarten

In terms of kindergarten, the demographic groups most similar to Immigrants from Scotland are Estonian (98.4%, a difference of 0.010%), Australian (98.4%, a difference of 0.010%), Celtic (98.4%, a difference of 0.010%), Pueblo (98.4%, a difference of 0.010%), and American (98.4%, a difference of 0.010%).
DemographicsRating | RankKindergarten
Ottawa
99.8
/100
|
#48
Exceptional
98.4%
Kiowa
99.8
/100
|
#49
Exceptional
98.4%
Whites/Caucasians
99.8
/100
|
#50
Exceptional
98.4%
Estonians
99.8
/100
|
#51
Exceptional
98.4%
Australians
99.8
/100
|
#52
Exceptional
98.4%
Celtics
99.8
/100
|
#53
Exceptional
98.4%
Pueblo
99.8
/100
|
#54
Exceptional
98.4%
Immigrants | Scotland
99.8
/100
|
#55
Exceptional
98.4%
Americans
99.8
/100
|
#56
Exceptional
98.4%
Austrians
99.8
/100
|
#57
Exceptional
98.4%
Bulgarians
99.7
/100
|
#58
Exceptional
98.4%
Immigrants | Canada
99.7
/100
|
#59
Exceptional
98.4%
Creek
99.7
/100
|
#60
Exceptional
98.4%
Slavs
99.7
/100
|
#61
Exceptional
98.4%
New Zealanders
99.7
/100
|
#62
Exceptional
98.4%