Colville vs Spanish American 4th Grade
COMPARE
Colville
Spanish American
4th Grade
4th Grade Comparison
Colville
Spanish Americans
97.7%
4TH GRADE
92.3/ 100
METRIC RATING
127th/ 347
METRIC RANK
97.5%
4TH GRADE
39.3/ 100
METRIC RATING
182nd/ 347
METRIC RANK
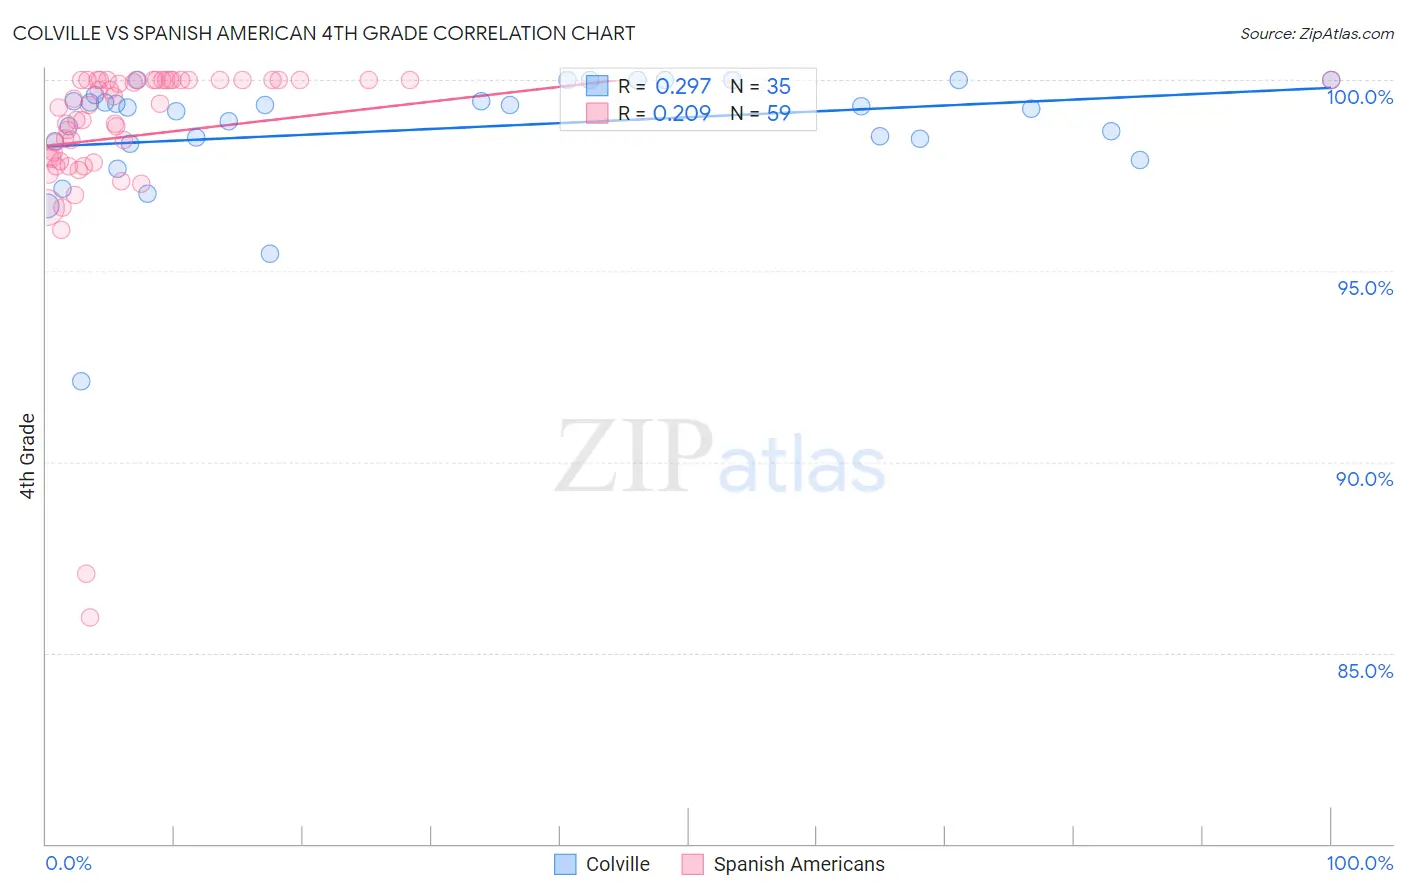
Colville vs Spanish American 4th Grade Correlation Chart
The statistical analysis conducted on geographies consisting of 34,687,839 people shows a weak positive correlation between the proportion of Colville and percentage of population with at least 4th grade education in the United States with a correlation coefficient (R) of 0.297 and weighted average of 97.7%. Similarly, the statistical analysis conducted on geographies consisting of 103,168,542 people shows a weak positive correlation between the proportion of Spanish Americans and percentage of population with at least 4th grade education in the United States with a correlation coefficient (R) of 0.209 and weighted average of 97.5%, a difference of 0.28%.
4th Grade Correlation Summary
| Measurement | Colville | Spanish American |
| Minimum | 92.1% | 85.9% |
| Maximum | 100.0% | 100.0% |
| Range | 7.9% | 14.1% |
| Mean | 98.7% | 98.6% |
| Median | 99.3% | 99.3% |
| Interquartile 25% (IQ1) | 98.4% | 97.9% |
| Interquartile 75% (IQ3) | 99.6% | 100.0% |
| Interquartile Range (IQR) | 1.2% | 2.1% |
| Standard Deviation (Sample) | 1.6% | 2.5% |
| Standard Deviation (Population) | 1.6% | 2.5% |
Similar Demographics by 4th Grade
Demographics Similar to Colville by 4th Grade
In terms of 4th grade, the demographic groups most similar to Colville are Immigrants from Serbia (97.8%, a difference of 0.0%), Immigrants from Europe (97.8%, a difference of 0.0%), Pima (97.7%, a difference of 0.0%), Immigrants from Bulgaria (97.7%, a difference of 0.010%), and Immigrants from Zimbabwe (97.8%, a difference of 0.020%).
| Demographics | Rating | Rank | 4th Grade |
| Immigrants | France | 94.8 /100 | #120 | Exceptional 97.8% |
| Immigrants | Norway | 94.2 /100 | #121 | Exceptional 97.8% |
| Immigrants | Japan | 94.1 /100 | #122 | Exceptional 97.8% |
| Immigrants | Zimbabwe | 93.9 /100 | #123 | Exceptional 97.8% |
| Spanish | 93.7 /100 | #124 | Exceptional 97.8% |
| Immigrants | Serbia | 92.6 /100 | #125 | Exceptional 97.8% |
| Immigrants | Europe | 92.5 /100 | #126 | Exceptional 97.8% |
| Colville | 92.3 /100 | #127 | Exceptional 97.7% |
| Pima | 92.0 /100 | #128 | Exceptional 97.7% |
| Immigrants | Bulgaria | 91.3 /100 | #129 | Exceptional 97.7% |
| Immigrants | Romania | 90.6 /100 | #130 | Exceptional 97.7% |
| Immigrants | Kuwait | 89.7 /100 | #131 | Excellent 97.7% |
| Immigrants | Hungary | 89.3 /100 | #132 | Excellent 97.7% |
| Hmong | 88.2 /100 | #133 | Excellent 97.7% |
| Palestinians | 88.1 /100 | #134 | Excellent 97.7% |
Demographics Similar to Spanish Americans by 4th Grade
In terms of 4th grade, the demographic groups most similar to Spanish Americans are Argentinean (97.5%, a difference of 0.0%), Immigrants from Venezuela (97.5%, a difference of 0.010%), Immigrants from Taiwan (97.5%, a difference of 0.010%), Pakistani (97.5%, a difference of 0.010%), and Immigrants from Kenya (97.5%, a difference of 0.010%).
| Demographics | Rating | Rank | 4th Grade |
| Immigrants | Micronesia | 49.6 /100 | #175 | Average 97.5% |
| Arabs | 48.7 /100 | #176 | Average 97.5% |
| Immigrants | Brazil | 46.1 /100 | #177 | Average 97.5% |
| Comanche | 45.3 /100 | #178 | Average 97.5% |
| Immigrants | Kazakhstan | 43.6 /100 | #179 | Average 97.5% |
| Immigrants | Venezuela | 42.7 /100 | #180 | Average 97.5% |
| Immigrants | Taiwan | 41.5 /100 | #181 | Average 97.5% |
| Spanish Americans | 39.3 /100 | #182 | Fair 97.5% |
| Argentineans | 39.0 /100 | #183 | Fair 97.5% |
| Pakistanis | 36.2 /100 | #184 | Fair 97.5% |
| Immigrants | Kenya | 35.8 /100 | #185 | Fair 97.5% |
| Dutch West Indians | 35.8 /100 | #186 | Fair 97.5% |
| Mongolians | 34.7 /100 | #187 | Fair 97.5% |
| Immigrants | Argentina | 34.6 /100 | #188 | Fair 97.5% |
| Panamanians | 31.9 /100 | #189 | Fair 97.4% |