Colville vs Lithuanian Nursery School

COMPARE

Colville
Race
Ancestry
AfghanAfricanAlaska NativeAlaskan AthabascanAlbanianAleutAlsatianAmericanApacheArabArapahoArgentineanArmenianAssyrian/Chaldean/SyriacAustralianAustrianBahamianBangladeshiBarbadianBasqueBelgianBelizeanBermudanBhutaneseBlackfeetBolivianBrazilianBritishBritish West IndianBulgarianBurmeseCajunCambodianCanadianCape VerdeanCarpatho RusynCelticCentral AmericanCentral American IndianCherokeeCheyenneChickasawChileanChineseChippewaChoctawColombianColvilleComancheCosta RicanCreeCreekCroatianCrowCubanCypriotCzechCzechoslovakianDanishDelawareDominicanDutchDutch West IndianEastern EuropeanEcuadorianEgyptianEnglishEstonianEthiopianEuropeanFijianFilipinoFinnishFrenchFrench American IndianFrench CanadianGermanGerman RussianGhanaianGreekGuamanian/ChamorroGuatemalanGuyaneseHaitianHmongHonduranHopiHoumaHungarianIcelanderIndian (Asian)IndonesianInupiatIranianIraqiIrishIroquoisIsraeliItalianJamaicanJapaneseJordanianKenyanKiowaKoreanLaotianLatvianLebaneseLiberianLumbeeLuxembourgerMacedonianMalaysianMalteseMarshalleseMenomineeMexicanMexican American IndianMongolianMoroccanNative HawaiianNavajoNepaleseNew ZealanderNicaraguanNigerianNorthern EuropeanNorwegianOkinawanOsageOttawaPaiutePakistaniPalestinianPanamanianParaguayanPennsylvania GermanPeruvianPimaPolishPortuguesePotawatomiPuebloPuerto RicanPuget Sound SalishRomanianRussianSalvadoranSamoanScandinavianScotch-IrishScottishSeminoleSenegaleseSerbianShoshoneSierra LeoneanSiouxSlavicSlovakSloveneSomaliSouth AfricanSouth AmericanSouth American IndianSoviet UnionSpaniardSpanishSpanish AmericanSpanish American IndianSri LankanSubsaharan AfricanSudaneseSwedishSwissSyrianTaiwaneseThaiTlingit-HaidaTohono O'OdhamTonganTrinidadian and TobagonianTsimshianTurkishU.S. Virgin IslanderUgandanUkrainianUruguayanUteVenezuelanVietnameseWelshWest IndianYakamaYaquiYugoslavianYumanYup'ikZimbabwean
Immigration
NonimmigrantsImmigrantsAfghanistanAfricaAlbaniaArgentinaArmeniaAsiaAustraliaAustriaBahamasBangladeshBarbadosBelarusBelgiumBelizeBoliviaBosnia and HerzegovinaBrazilBulgariaBurma/MyanmarCabo VerdeCambodiaCameroonCanadaCaribbeanCentral AmericaChileChinaColombiaCongoCosta RicaCroatiaCubaCzechoslovakiaDenmarkDominicaDominican RepublicEastern AfricaEastern AsiaEastern EuropeEcuadorEgyptEl SalvadorEnglandEritreaEthiopiaEuropeFijiFranceGermanyGhanaGreeceGrenadaGuatemalaGuyanaHaitiHondurasHong KongHungaryIndiaIndonesiaIranIraqIrelandIsraelItalyJamaicaJapanJordanKazakhstanKenyaKoreaKuwaitLaosLatin AmericaLatviaLebanonLiberiaLithuaniaMalaysiaMexicoMicronesiaMiddle AfricaMoldovaMoroccoNepalNetherlandsNicaraguaNigeriaNorth AmericaNorth MacedoniaNorthern AfricaNorthern EuropeNorwayOceaniaPakistanPanamaPeruPhilippinesPolandPortugalRomaniaRussiaSaudi ArabiaScotlandSenegalSerbiaSierra LeoneSingaporeSomaliaSouth AfricaSouth AmericaSouth Central AsiaSouth Eastern AsiaSouthern EuropeSpainSri LankaSt. Vincent and the GrenadinesSudanSwedenSwitzerlandSyriaTaiwanThailandTrinidad and TobagoTurkeyUgandaUkraineUruguayUzbekistanVenezuelaVietnamWest IndiesWestern AfricaWestern AsiaWestern EuropeYemenZaireZimbabweAzores
Lithuanian
Race
Ancestry
AfghanAfricanAlaska NativeAlaskan AthabascanAlbanianAleutAlsatianAmericanApacheArabArapahoArgentineanArmenianAssyrian/Chaldean/SyriacAustralianAustrianBahamianBangladeshiBarbadianBasqueBelgianBelizeanBermudanBhutaneseBlackfeetBolivianBrazilianBritishBritish West IndianBulgarianBurmeseCajunCambodianCanadianCape VerdeanCarpatho RusynCelticCentral AmericanCentral American IndianCherokeeCheyenneChickasawChileanChineseChippewaChoctawColombianComancheCosta RicanCreeCreekCroatianCrowCubanCypriotCzechCzechoslovakianDanishDelawareDominicanDutchDutch West IndianEastern EuropeanEcuadorianEgyptianEnglishEstonianEthiopianEuropeanFijianFilipinoFinnishFrenchFrench American IndianFrench CanadianGermanGerman RussianGhanaianGreekGuamanian/ChamorroGuatemalanGuyaneseHaitianHmongHonduranHopiHoumaHungarianIcelanderIndian (Asian)IndonesianInupiatIranianIraqiIrishIroquoisIsraeliItalianJamaicanJapaneseJordanianKenyanKiowaKoreanLaotianLatvianLebaneseLiberianLithuanianLumbeeLuxembourgerMacedonianMalaysianMalteseMarshalleseMenomineeMexicanMexican American IndianMongolianMoroccanNative HawaiianNavajoNepaleseNew ZealanderNicaraguanNigerianNorthern EuropeanNorwegianOkinawanOsageOttawaPaiutePakistaniPalestinianPanamanianParaguayanPennsylvania GermanPeruvianPimaPolishPortuguesePotawatomiPuebloPuerto RicanPuget Sound SalishRomanianRussianSalvadoranSamoanScandinavianScotch-IrishScottishSeminoleSenegaleseSerbianShoshoneSierra LeoneanSiouxSlavicSlovakSloveneSomaliSouth AfricanSouth AmericanSouth American IndianSoviet UnionSpaniardSpanishSpanish AmericanSpanish American IndianSri LankanSubsaharan AfricanSudaneseSwedishSwissSyrianTaiwaneseThaiTlingit-HaidaTohono O'OdhamTonganTrinidadian and TobagonianTsimshianTurkishU.S. Virgin IslanderUgandanUkrainianUruguayanUteVenezuelanVietnameseWelshWest IndianYakamaYaquiYugoslavianYumanYup'ikZimbabwean
Immigration
NonimmigrantsImmigrantsAfghanistanAfricaAlbaniaArgentinaArmeniaAsiaAustraliaAustriaBahamasBangladeshBarbadosBelarusBelgiumBelizeBoliviaBosnia and HerzegovinaBrazilBulgariaBurma/MyanmarCabo VerdeCambodiaCameroonCanadaCaribbeanCentral AmericaChileChinaColombiaCongoCosta RicaCroatiaCubaCzechoslovakiaDenmarkDominicaDominican RepublicEastern AfricaEastern AsiaEastern EuropeEcuadorEgyptEl SalvadorEnglandEritreaEthiopiaEuropeFijiFranceGermanyGhanaGreeceGrenadaGuatemalaGuyanaHaitiHondurasHong KongHungaryIndiaIndonesiaIranIraqIrelandIsraelItalyJamaicaJapanJordanKazakhstanKenyaKoreaKuwaitLaosLatin AmericaLatviaLebanonLiberiaLithuaniaMalaysiaMexicoMicronesiaMiddle AfricaMoldovaMoroccoNepalNetherlandsNicaraguaNigeriaNorth AmericaNorth MacedoniaNorthern AfricaNorthern EuropeNorwayOceaniaPakistanPanamaPeruPhilippinesPolandPortugalRomaniaRussiaSaudi ArabiaScotlandSenegalSerbiaSierra LeoneSingaporeSomaliaSouth AfricaSouth AmericaSouth Central AsiaSouth Eastern AsiaSouthern EuropeSpainSri LankaSt. Vincent and the GrenadinesSudanSwedenSwitzerlandSyriaTaiwanThailandTrinidad and TobagoTurkeyUgandaUkraineUruguayUzbekistanVenezuelaVietnamWest IndiesWestern AfricaWestern AsiaWestern EuropeYemenZaireZimbabweAzores
Nursery School
Income
Poverty
Unemployment
Labor Participation
Family Structure
Vehicle Availability
Education Level
Disability

Nursery School Comparison

Colville

Lithuanians

Exceptional
Exceptional
98.3%
NURSERY SCHOOL
98.2/ 100
METRIC RATING
99th/ 347
METRIC RANK
98.6%
NURSERY SCHOOL
100.0/ 100
METRIC RATING
22nd/ 347
METRIC RANK

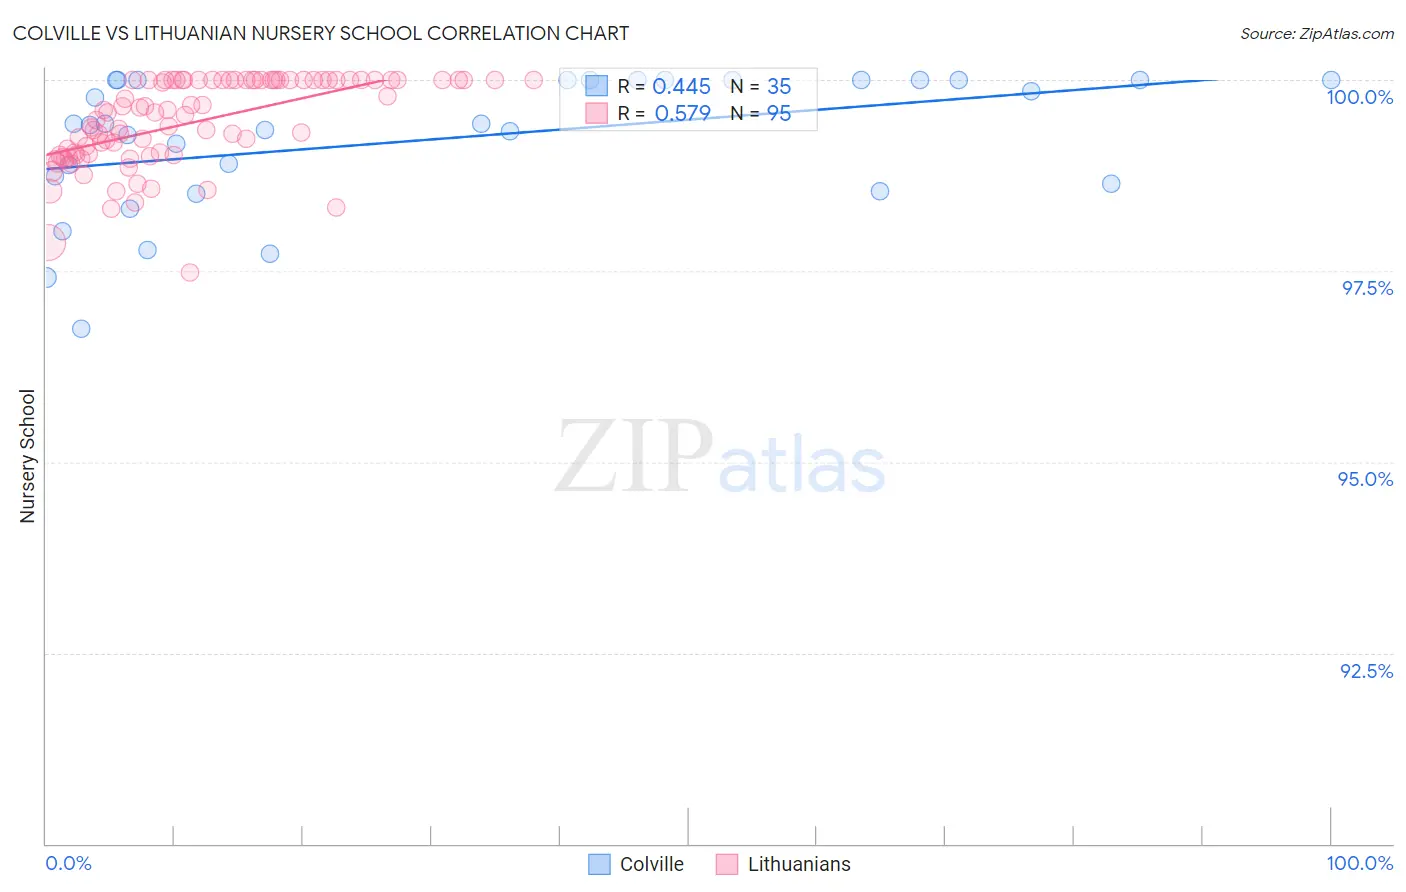
Colville vs Lithuanian Nursery School Correlation Chart

The statistical analysis conducted on geographies consisting of 34,687,839 people shows a moderate positive correlation between the proportion of Colville and percentage of population with at least nursery school education in the United States with a correlation coefficient (R) of 0.445 and weighted average of 98.3%. Similarly, the statistical analysis conducted on geographies consisting of 421,946,231 people shows a substantial positive correlation between the proportion of Lithuanians and percentage of population with at least nursery school education in the United States with a correlation coefficient (R) of 0.579 and weighted average of 98.6%, a difference of 0.36%.
Colville vs Lithuanian Nursery School

Nursery School Correlation Summary

MeasurementColvilleLithuanian
Minimum96.7%97.5%
Maximum100.0%100.0%
Range3.3%2.5%
Mean99.2%99.4%
Median99.4%99.6%
Interquartile 25% (IQ1)98.6%99.0%
Interquartile 75% (IQ3)100.0%100.0%
Interquartile Range (IQR)1.4%0.98%
Standard Deviation (Sample)0.88%0.57%
Standard Deviation (Population)0.87%0.57%

Similar Demographics by Nursery School

Demographics Similar to Colville by Nursery School

In terms of nursery school, the demographic groups most similar to Colville are Choctaw (98.3%, a difference of 0.0%), Cypriot (98.3%, a difference of 0.010%), Nonimmigrants (98.3%, a difference of 0.010%), Puget Sound Salish (98.3%, a difference of 0.010%), and Romanian (98.3%, a difference of 0.010%).
DemographicsRating | RankNursery School
Macedonians
98.7
/100
|
#92
Exceptional
98.3%
Immigrants | India
98.7
/100
|
#93
Exceptional
98.3%
Immigrants | Germany
98.6
/100
|
#94
Exceptional
98.3%
South Africans
98.6
/100
|
#95
Exceptional
98.3%
Cypriots
98.3
/100
|
#96
Exceptional
98.3%
Immigrants | Nonimmigrants
98.3
/100
|
#97
Exceptional
98.3%
Choctaw
98.3
/100
|
#98
Exceptional
98.3%
Colville
98.2
/100
|
#99
Exceptional
98.3%
Puget Sound Salish
98.0
/100
|
#100
Exceptional
98.3%
Romanians
97.9
/100
|
#101
Exceptional
98.3%
Immigrants | Ireland
97.7
/100
|
#102
Exceptional
98.3%
Cree
97.7
/100
|
#103
Exceptional
98.3%
Bhutanese
97.4
/100
|
#104
Exceptional
98.2%
Turks
97.4
/100
|
#105
Exceptional
98.2%
Immigrants | Switzerland
97.3
/100
|
#106
Exceptional
98.2%

Demographics Similar to Lithuanians by Nursery School

In terms of nursery school, the demographic groups most similar to Lithuanians are Pennsylvania German (98.6%, a difference of 0.0%), Finnish (98.6%, a difference of 0.0%), Polish (98.6%, a difference of 0.0%), Danish (98.6%, a difference of 0.0%), and Scotch-Irish (98.6%, a difference of 0.0%).
DemographicsRating | RankNursery School
Swedes
100.0
/100
|
#15
Exceptional
98.7%
Scottish
100.0
/100
|
#16
Exceptional
98.7%
Aleuts
100.0
/100
|
#17
Exceptional
98.7%
Dutch
100.0
/100
|
#18
Exceptional
98.7%
Irish
100.0
/100
|
#19
Exceptional
98.6%
Pennsylvania Germans
100.0
/100
|
#20
Exceptional
98.6%
Finns
100.0
/100
|
#21
Exceptional
98.6%
Lithuanians
100.0
/100
|
#22
Exceptional
98.6%
Poles
100.0
/100
|
#23
Exceptional
98.6%
Danes
100.0
/100
|
#24
Exceptional
98.6%
Scotch-Irish
100.0
/100
|
#25
Exceptional
98.6%
Sioux
100.0
/100
|
#26
Exceptional
98.6%
Arapaho
100.0
/100
|
#27
Exceptional
98.6%
Croatians
100.0
/100
|
#28
Exceptional
98.6%
French
100.0
/100
|
#29
Exceptional
98.6%