Colville vs Immigrants from Dominican Republic Bachelor's Degree
COMPARE
Colville
Immigrants from Dominican Republic
Bachelor's Degree
Bachelor's Degree Comparison
Colville
Immigrants from Dominican Republic
29.0%
BACHELOR'S DEGREE
0.0/ 100
METRIC RATING
317th/ 347
METRIC RANK
30.7%
BACHELOR'S DEGREE
0.0/ 100
METRIC RATING
295th/ 347
METRIC RANK
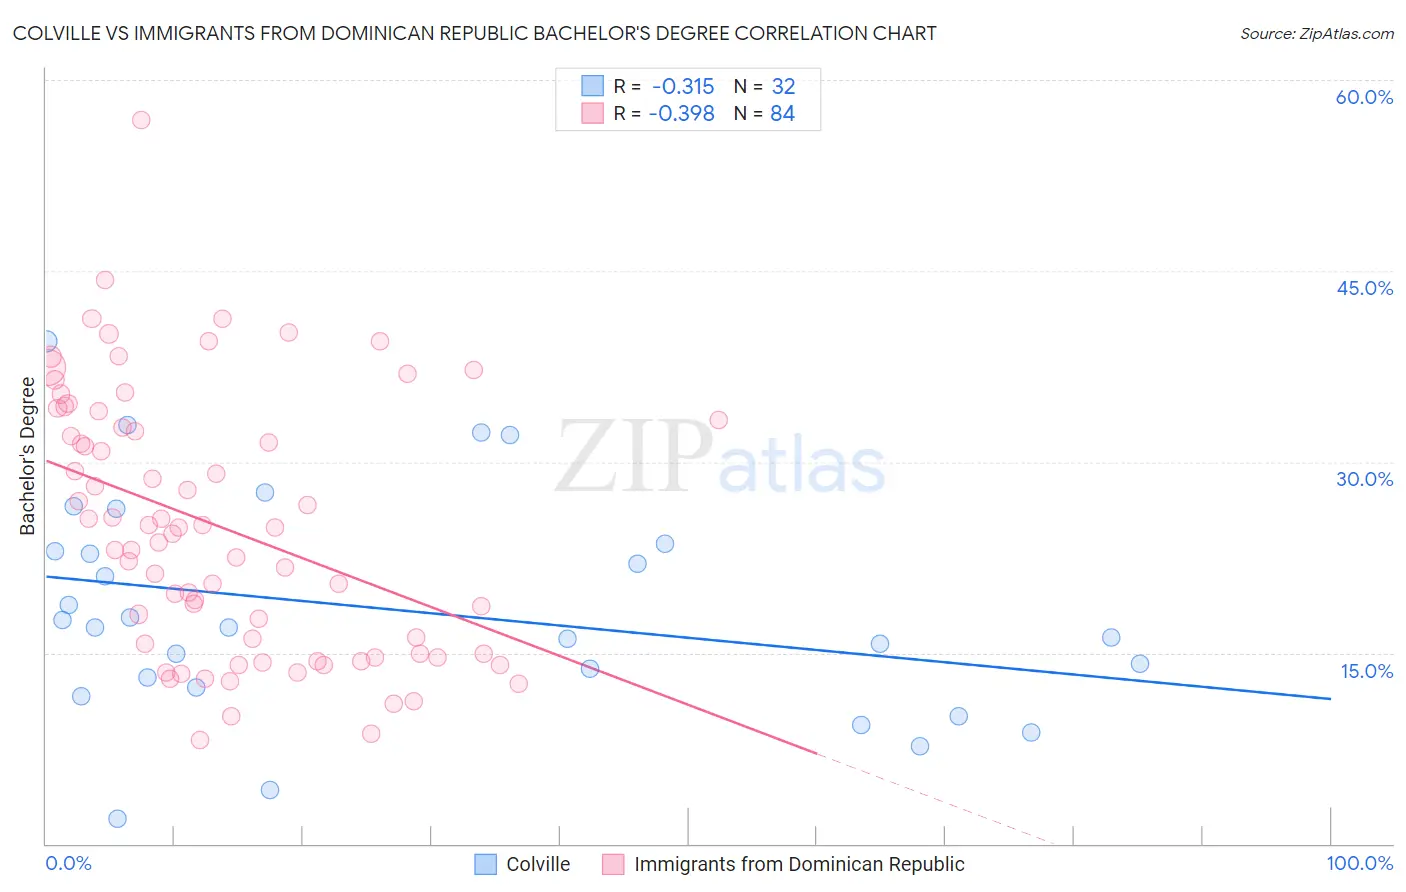
Colville vs Immigrants from Dominican Republic Bachelor's Degree Correlation Chart
The statistical analysis conducted on geographies consisting of 34,683,925 people shows a mild negative correlation between the proportion of Colville and percentage of population with at least bachelor's degree education in the United States with a correlation coefficient (R) of -0.315 and weighted average of 29.0%. Similarly, the statistical analysis conducted on geographies consisting of 275,132,010 people shows a mild negative correlation between the proportion of Immigrants from Dominican Republic and percentage of population with at least bachelor's degree education in the United States with a correlation coefficient (R) of -0.398 and weighted average of 30.7%, a difference of 5.8%.
Bachelor's Degree Correlation Summary
| Measurement | Colville | Immigrants from Dominican Republic |
| Minimum | 1.9% | 8.2% |
| Maximum | 39.5% | 56.8% |
| Range | 37.5% | 48.6% |
| Mean | 18.3% | 24.9% |
| Median | 17.0% | 24.6% |
| Interquartile 25% (IQ1) | 12.7% | 14.9% |
| Interquartile 75% (IQ3) | 23.2% | 33.0% |
| Interquartile Range (IQR) | 10.6% | 18.1% |
| Standard Deviation (Sample) | 8.7% | 10.2% |
| Standard Deviation (Population) | 8.6% | 10.1% |
Similar Demographics by Bachelor's Degree
Demographics Similar to Colville by Bachelor's Degree
In terms of bachelor's degree, the demographic groups most similar to Colville are Yaqui (29.0%, a difference of 0.050%), Sioux (29.1%, a difference of 0.20%), Creek (28.9%, a difference of 0.50%), Kiowa (28.8%, a difference of 0.55%), and Alaskan Athabascan (28.8%, a difference of 0.63%).
| Demographics | Rating | Rank | Bachelor's Degree |
| Cheyenne | 0.0 /100 | #310 | Tragic 29.4% |
| Choctaw | 0.0 /100 | #311 | Tragic 29.4% |
| Seminole | 0.0 /100 | #312 | Tragic 29.4% |
| Alaska Natives | 0.0 /100 | #313 | Tragic 29.4% |
| Shoshone | 0.0 /100 | #314 | Tragic 29.3% |
| Immigrants | Cabo Verde | 0.0 /100 | #315 | Tragic 29.2% |
| Sioux | 0.0 /100 | #316 | Tragic 29.1% |
| Colville | 0.0 /100 | #317 | Tragic 29.0% |
| Yaqui | 0.0 /100 | #318 | Tragic 29.0% |
| Creek | 0.0 /100 | #319 | Tragic 28.9% |
| Kiowa | 0.0 /100 | #320 | Tragic 28.8% |
| Alaskan Athabascans | 0.0 /100 | #321 | Tragic 28.8% |
| Tsimshian | 0.0 /100 | #322 | Tragic 28.8% |
| Fijians | 0.0 /100 | #323 | Tragic 28.7% |
| Dutch West Indians | 0.0 /100 | #324 | Tragic 28.5% |
Demographics Similar to Immigrants from Dominican Republic by Bachelor's Degree
In terms of bachelor's degree, the demographic groups most similar to Immigrants from Dominican Republic are Puget Sound Salish (30.7%, a difference of 0.10%), Immigrants from Haiti (30.6%, a difference of 0.16%), Immigrants from Guatemala (30.8%, a difference of 0.24%), Chippewa (30.6%, a difference of 0.41%), and Cape Verdean (30.9%, a difference of 0.63%).
| Demographics | Rating | Rank | Bachelor's Degree |
| Guatemalans | 0.1 /100 | #288 | Tragic 31.0% |
| Puerto Ricans | 0.1 /100 | #289 | Tragic 31.0% |
| Immigrants | Honduras | 0.1 /100 | #290 | Tragic 30.9% |
| Blacks/African Americans | 0.1 /100 | #291 | Tragic 30.9% |
| Ute | 0.1 /100 | #292 | Tragic 30.9% |
| Cape Verdeans | 0.1 /100 | #293 | Tragic 30.9% |
| Immigrants | Guatemala | 0.0 /100 | #294 | Tragic 30.8% |
| Immigrants | Dominican Republic | 0.0 /100 | #295 | Tragic 30.7% |
| Puget Sound Salish | 0.0 /100 | #296 | Tragic 30.7% |
| Immigrants | Haiti | 0.0 /100 | #297 | Tragic 30.6% |
| Chippewa | 0.0 /100 | #298 | Tragic 30.6% |
| Chickasaw | 0.0 /100 | #299 | Tragic 30.4% |
| Immigrants | Micronesia | 0.0 /100 | #300 | Tragic 30.4% |
| Immigrants | Cuba | 0.0 /100 | #301 | Tragic 30.3% |
| Mexican American Indians | 0.0 /100 | #302 | Tragic 30.2% |