Colombian vs Bangladeshi High School Diploma
COMPARE
Colombian
Bangladeshi
High School Diploma
High School Diploma Comparison
Colombians
Bangladeshis
88.1%
HIGH SCHOOL DIPLOMA
3.8/ 100
METRIC RATING
231st/ 347
METRIC RANK
86.9%
HIGH SCHOOL DIPLOMA
0.1/ 100
METRIC RATING
274th/ 347
METRIC RANK
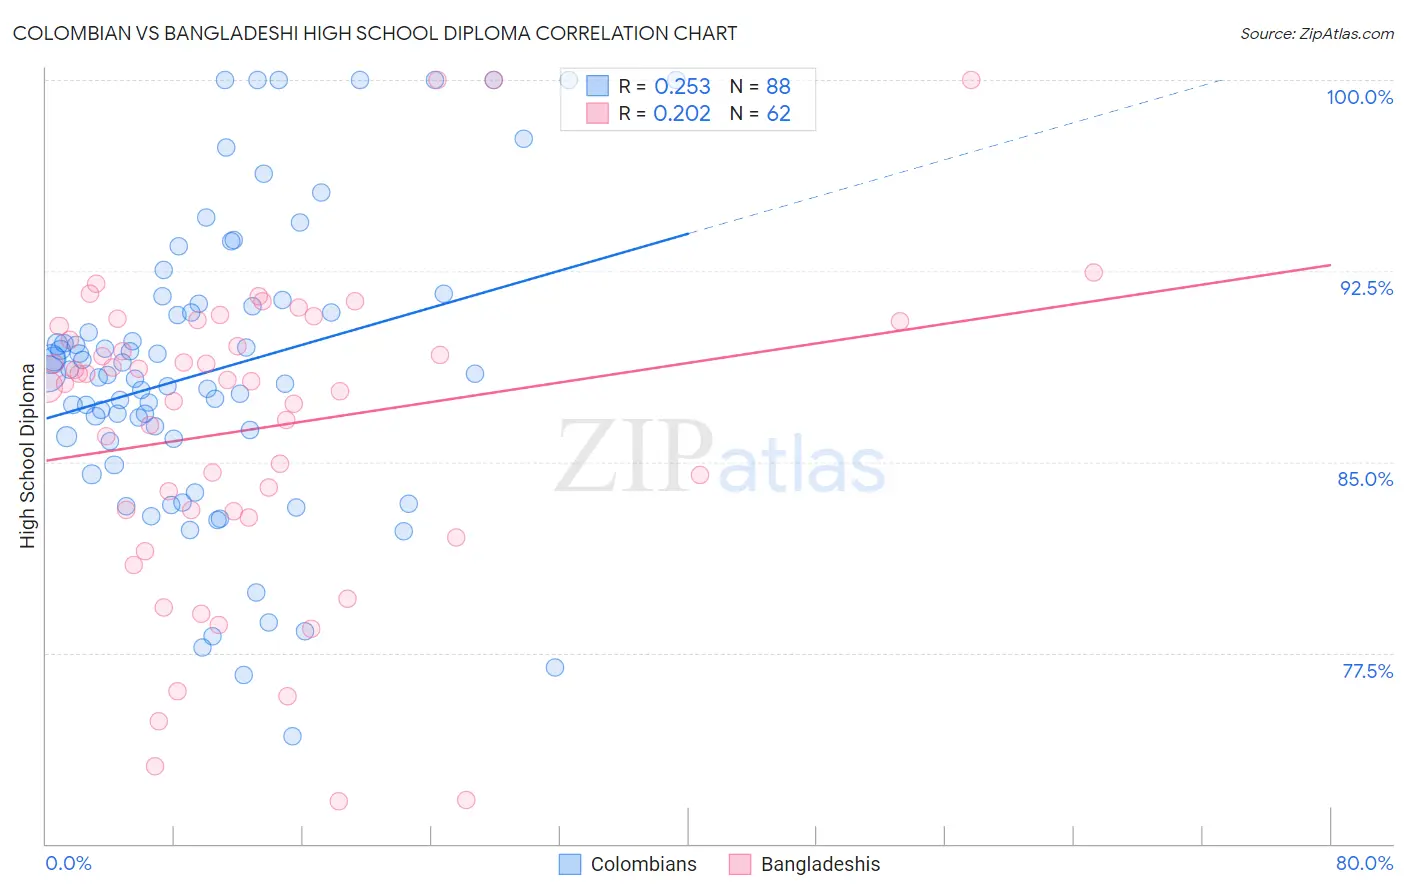
Colombian vs Bangladeshi High School Diploma Correlation Chart
The statistical analysis conducted on geographies consisting of 419,701,311 people shows a weak positive correlation between the proportion of Colombians and percentage of population with at least high school diploma education in the United States with a correlation coefficient (R) of 0.253 and weighted average of 88.1%. Similarly, the statistical analysis conducted on geographies consisting of 141,450,108 people shows a weak positive correlation between the proportion of Bangladeshis and percentage of population with at least high school diploma education in the United States with a correlation coefficient (R) of 0.202 and weighted average of 86.9%, a difference of 1.4%.
High School Diploma Correlation Summary
| Measurement | Colombian | Bangladeshi |
| Minimum | 74.2% | 71.7% |
| Maximum | 100.0% | 100.0% |
| Range | 25.8% | 28.3% |
| Mean | 88.6% | 86.3% |
| Median | 88.4% | 88.1% |
| Interquartile 25% (IQ1) | 85.9% | 83.1% |
| Interquartile 75% (IQ3) | 91.2% | 90.3% |
| Interquartile Range (IQR) | 5.3% | 7.3% |
| Standard Deviation (Sample) | 5.8% | 6.2% |
| Standard Deviation (Population) | 5.8% | 6.1% |
Similar Demographics by High School Diploma
Demographics Similar to Colombians by High School Diploma
In terms of high school diploma, the demographic groups most similar to Colombians are Blackfeet (88.1%, a difference of 0.040%), Immigrants from Middle Africa (88.0%, a difference of 0.050%), Immigrants from Panama (88.0%, a difference of 0.080%), Immigrants from Thailand (88.0%, a difference of 0.090%), and Immigrants from Bahamas (88.0%, a difference of 0.10%).
| Demographics | Rating | Rank | High School Diploma |
| Shoshone | 7.0 /100 | #224 | Tragic 88.3% |
| Creek | 6.9 /100 | #225 | Tragic 88.3% |
| Uruguayans | 5.6 /100 | #226 | Tragic 88.2% |
| Immigrants | Liberia | 5.5 /100 | #227 | Tragic 88.2% |
| Kiowa | 5.3 /100 | #228 | Tragic 88.2% |
| Nigerians | 5.2 /100 | #229 | Tragic 88.2% |
| Blackfeet | 4.2 /100 | #230 | Tragic 88.1% |
| Colombians | 3.8 /100 | #231 | Tragic 88.1% |
| Immigrants | Middle Africa | 3.4 /100 | #232 | Tragic 88.0% |
| Immigrants | Panama | 3.1 /100 | #233 | Tragic 88.0% |
| Immigrants | Thailand | 3.1 /100 | #234 | Tragic 88.0% |
| Immigrants | Bahamas | 2.9 /100 | #235 | Tragic 88.0% |
| Sub-Saharan Africans | 2.8 /100 | #236 | Tragic 87.9% |
| Taiwanese | 2.8 /100 | #237 | Tragic 87.9% |
| Sioux | 2.7 /100 | #238 | Tragic 87.9% |
Demographics Similar to Bangladeshis by High School Diploma
In terms of high school diploma, the demographic groups most similar to Bangladeshis are Immigrants from Jamaica (86.9%, a difference of 0.010%), Trinidadian and Tobagonian (86.9%, a difference of 0.040%), West Indian (86.9%, a difference of 0.050%), Malaysian (87.0%, a difference of 0.12%), and Sri Lankan (87.0%, a difference of 0.13%).
| Demographics | Rating | Rank | High School Diploma |
| Blacks/African Americans | 0.2 /100 | #267 | Tragic 87.0% |
| Pennsylvania Germans | 0.2 /100 | #268 | Tragic 87.0% |
| Sri Lankans | 0.2 /100 | #269 | Tragic 87.0% |
| Malaysians | 0.2 /100 | #270 | Tragic 87.0% |
| West Indians | 0.1 /100 | #271 | Tragic 86.9% |
| Trinidadians and Tobagonians | 0.1 /100 | #272 | Tragic 86.9% |
| Immigrants | Jamaica | 0.1 /100 | #273 | Tragic 86.9% |
| Bangladeshis | 0.1 /100 | #274 | Tragic 86.9% |
| Immigrants | Trinidad and Tobago | 0.1 /100 | #275 | Tragic 86.8% |
| Immigrants | Burma/Myanmar | 0.1 /100 | #276 | Tragic 86.7% |
| Barbadians | 0.1 /100 | #277 | Tragic 86.7% |
| Hopi | 0.1 /100 | #278 | Tragic 86.6% |
| Immigrants | Laos | 0.0 /100 | #279 | Tragic 86.6% |
| Pueblo | 0.0 /100 | #280 | Tragic 86.5% |
| Indonesians | 0.0 /100 | #281 | Tragic 86.5% |