Choctaw vs Ugandan 6th Grade

COMPARE

Choctaw
Race
Ancestry
AfghanAfricanAlaska NativeAlaskan AthabascanAlbanianAleutAlsatianAmericanApacheArabArapahoArgentineanArmenianAssyrian/Chaldean/SyriacAustralianAustrianBahamianBangladeshiBarbadianBasqueBelgianBelizeanBermudanBhutaneseBlackfeetBolivianBrazilianBritishBritish West IndianBulgarianBurmeseCajunCambodianCanadianCape VerdeanCarpatho RusynCelticCentral AmericanCentral American IndianCherokeeCheyenneChickasawChileanChineseChippewaChoctawColombianColvilleComancheCosta RicanCreeCreekCroatianCrowCubanCypriotCzechCzechoslovakianDanishDelawareDominicanDutchDutch West IndianEastern EuropeanEcuadorianEgyptianEnglishEstonianEthiopianEuropeanFijianFilipinoFinnishFrenchFrench American IndianFrench CanadianGermanGerman RussianGhanaianGreekGuamanian/ChamorroGuatemalanGuyaneseHaitianHmongHonduranHopiHoumaHungarianIcelanderIndian (Asian)IndonesianInupiatIranianIraqiIrishIroquoisIsraeliItalianJamaicanJapaneseJordanianKenyanKiowaKoreanLaotianLatvianLebaneseLiberianLithuanianLumbeeLuxembourgerMacedonianMalaysianMalteseMarshalleseMenomineeMexicanMexican American IndianMongolianMoroccanNative HawaiianNavajoNepaleseNew ZealanderNicaraguanNigerianNorthern EuropeanNorwegianOkinawanOsageOttawaPaiutePakistaniPalestinianPanamanianParaguayanPennsylvania GermanPeruvianPimaPolishPortuguesePotawatomiPuebloPuerto RicanPuget Sound SalishRomanianRussianSalvadoranSamoanScandinavianScotch-IrishScottishSeminoleSenegaleseSerbianShoshoneSierra LeoneanSiouxSlavicSlovakSloveneSomaliSouth AfricanSouth AmericanSouth American IndianSoviet UnionSpaniardSpanishSpanish AmericanSpanish American IndianSri LankanSubsaharan AfricanSudaneseSwedishSwissSyrianTaiwaneseThaiTlingit-HaidaTohono O'OdhamTonganTrinidadian and TobagonianTsimshianTurkishU.S. Virgin IslanderUkrainianUruguayanUteVenezuelanVietnameseWelshWest IndianYakamaYaquiYugoslavianYumanYup'ikZimbabwean
Immigration
NonimmigrantsImmigrantsAfghanistanAfricaAlbaniaArgentinaArmeniaAsiaAustraliaAustriaBahamasBangladeshBarbadosBelarusBelgiumBelizeBoliviaBosnia and HerzegovinaBrazilBulgariaBurma/MyanmarCabo VerdeCambodiaCameroonCanadaCaribbeanCentral AmericaChileChinaColombiaCongoCosta RicaCroatiaCubaCzechoslovakiaDenmarkDominicaDominican RepublicEastern AfricaEastern AsiaEastern EuropeEcuadorEgyptEl SalvadorEnglandEritreaEthiopiaEuropeFijiFranceGermanyGhanaGreeceGrenadaGuatemalaGuyanaHaitiHondurasHong KongHungaryIndiaIndonesiaIranIraqIrelandIsraelItalyJamaicaJapanJordanKazakhstanKenyaKoreaKuwaitLaosLatin AmericaLatviaLebanonLiberiaLithuaniaMalaysiaMexicoMicronesiaMiddle AfricaMoldovaMoroccoNepalNetherlandsNicaraguaNigeriaNorth AmericaNorth MacedoniaNorthern AfricaNorthern EuropeNorwayOceaniaPakistanPanamaPeruPhilippinesPolandPortugalRomaniaRussiaSaudi ArabiaScotlandSenegalSerbiaSierra LeoneSingaporeSomaliaSouth AfricaSouth AmericaSouth Central AsiaSouth Eastern AsiaSouthern EuropeSpainSri LankaSt. Vincent and the GrenadinesSudanSwedenSwitzerlandSyriaTaiwanThailandTrinidad and TobagoTurkeyUgandaUkraineUruguayUzbekistanVenezuelaVietnamWest IndiesWestern AfricaWestern AsiaWestern EuropeYemenZaireZimbabweAzores
Ugandan
Race
Ancestry
AfghanAfricanAlaska NativeAlaskan AthabascanAlbanianAleutAlsatianAmericanApacheArabArapahoArgentineanArmenianAssyrian/Chaldean/SyriacAustralianAustrianBahamianBangladeshiBarbadianBasqueBelgianBelizeanBermudanBhutaneseBlackfeetBolivianBrazilianBritishBritish West IndianBulgarianBurmeseCajunCambodianCanadianCape VerdeanCarpatho RusynCelticCentral AmericanCentral American IndianCherokeeCheyenneChickasawChileanChineseChippewaColombianColvilleComancheCosta RicanCreeCreekCroatianCrowCubanCypriotCzechCzechoslovakianDanishDelawareDominicanDutchDutch West IndianEastern EuropeanEcuadorianEgyptianEnglishEstonianEthiopianEuropeanFijianFilipinoFinnishFrenchFrench American IndianFrench CanadianGermanGerman RussianGhanaianGreekGuamanian/ChamorroGuatemalanGuyaneseHaitianHmongHonduranHopiHoumaHungarianIcelanderIndian (Asian)IndonesianInupiatIranianIraqiIrishIroquoisIsraeliItalianJamaicanJapaneseJordanianKenyanKiowaKoreanLaotianLatvianLebaneseLiberianLithuanianLumbeeLuxembourgerMacedonianMalaysianMalteseMarshalleseMenomineeMexicanMexican American IndianMongolianMoroccanNative HawaiianNavajoNepaleseNew ZealanderNicaraguanNigerianNorthern EuropeanNorwegianOkinawanOsageOttawaPaiutePakistaniPalestinianPanamanianParaguayanPennsylvania GermanPeruvianPimaPolishPortuguesePotawatomiPuebloPuerto RicanPuget Sound SalishRomanianRussianSalvadoranSamoanScandinavianScotch-IrishScottishSeminoleSenegaleseSerbianShoshoneSierra LeoneanSiouxSlavicSlovakSloveneSomaliSouth AfricanSouth AmericanSouth American IndianSoviet UnionSpaniardSpanishSpanish AmericanSpanish American IndianSri LankanSubsaharan AfricanSudaneseSwedishSwissSyrianTaiwaneseThaiTlingit-HaidaTohono O'OdhamTonganTrinidadian and TobagonianTsimshianTurkishU.S. Virgin IslanderUgandanUkrainianUruguayanUteVenezuelanVietnameseWelshWest IndianYakamaYaquiYugoslavianYumanYup'ikZimbabwean
Immigration
NonimmigrantsImmigrantsAfghanistanAfricaAlbaniaArgentinaArmeniaAsiaAustraliaAustriaBahamasBangladeshBarbadosBelarusBelgiumBelizeBoliviaBosnia and HerzegovinaBrazilBulgariaBurma/MyanmarCabo VerdeCambodiaCameroonCanadaCaribbeanCentral AmericaChileChinaColombiaCongoCosta RicaCroatiaCubaCzechoslovakiaDenmarkDominicaDominican RepublicEastern AfricaEastern AsiaEastern EuropeEcuadorEgyptEl SalvadorEnglandEritreaEthiopiaEuropeFijiFranceGermanyGhanaGreeceGrenadaGuatemalaGuyanaHaitiHondurasHong KongHungaryIndiaIndonesiaIranIraqIrelandIsraelItalyJamaicaJapanJordanKazakhstanKenyaKoreaKuwaitLaosLatin AmericaLatviaLebanonLiberiaLithuaniaMalaysiaMexicoMicronesiaMiddle AfricaMoldovaMoroccoNepalNetherlandsNicaraguaNigeriaNorth AmericaNorth MacedoniaNorthern AfricaNorthern EuropeNorwayOceaniaPakistanPanamaPeruPhilippinesPolandPortugalRomaniaRussiaSaudi ArabiaScotlandSenegalSerbiaSierra LeoneSingaporeSomaliaSouth AfricaSouth AmericaSouth Central AsiaSouth Eastern AsiaSouthern EuropeSpainSri LankaSt. Vincent and the GrenadinesSudanSwedenSwitzerlandSyriaTaiwanThailandTrinidad and TobagoTurkeyUgandaUkraineUruguayUzbekistanVenezuelaVietnamWest IndiesWestern AfricaWestern AsiaWestern EuropeYemenZaireZimbabweAzores
6th Grade
Income
Poverty
Unemployment
Labor Participation
Family Structure
Vehicle Availability
Education Level
Disability

6th Grade Comparison

Choctaw

Ugandans

Exceptional
Good
97.5%
6TH GRADE
98.0/ 100
METRIC RATING
102nd/ 347
METRIC RANK
97.1%
6TH GRADE
62.2/ 100
METRIC RATING
160th/ 347
METRIC RANK

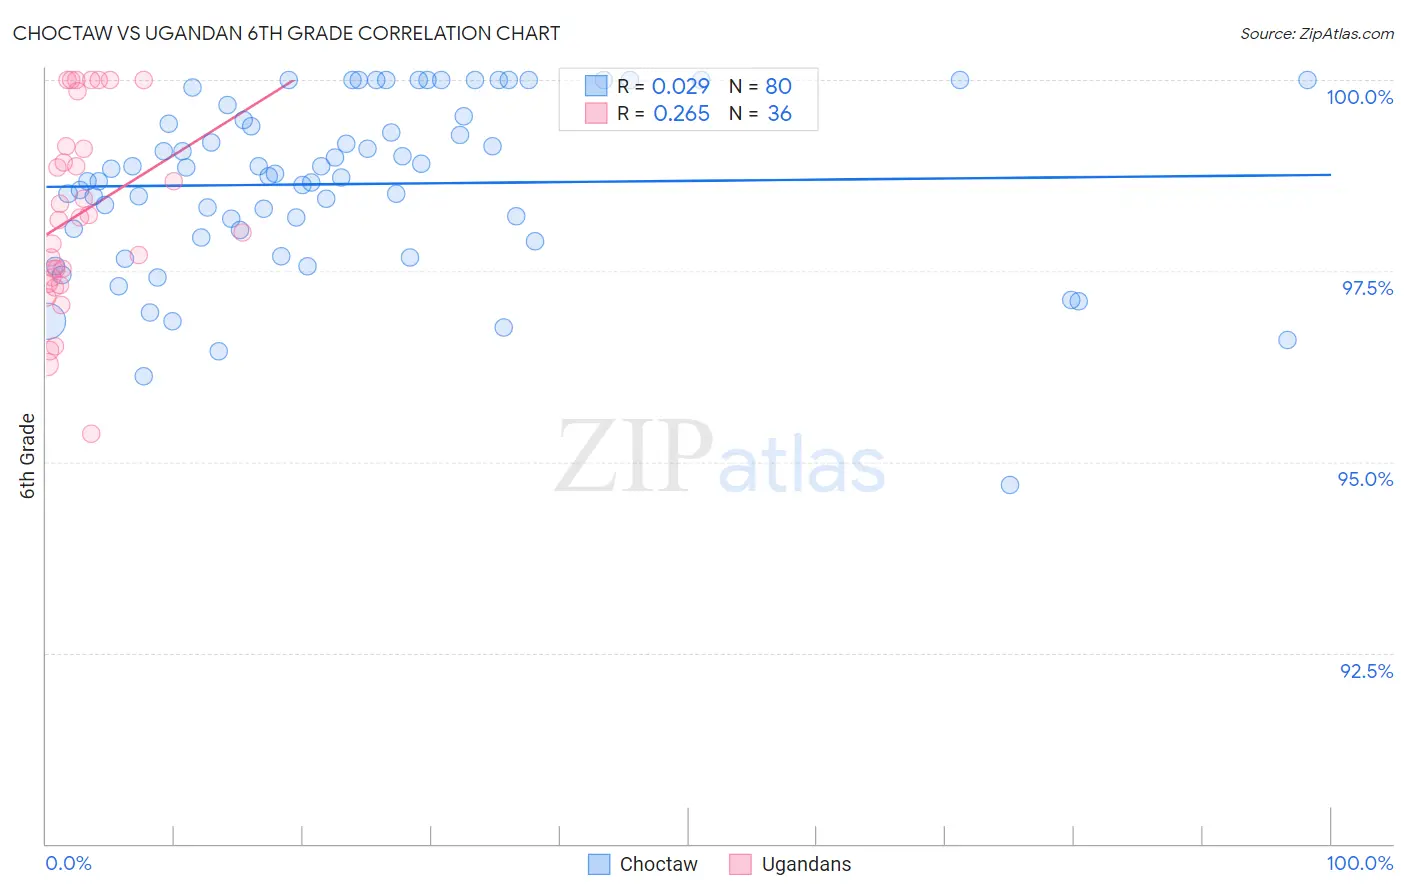
Choctaw vs Ugandan 6th Grade Correlation Chart

The statistical analysis conducted on geographies consisting of 269,741,679 people shows no correlation between the proportion of Choctaw and percentage of population with at least 6th grade education in the United States with a correlation coefficient (R) of 0.029 and weighted average of 97.5%. Similarly, the statistical analysis conducted on geographies consisting of 93,991,892 people shows a weak positive correlation between the proportion of Ugandans and percentage of population with at least 6th grade education in the United States with a correlation coefficient (R) of 0.265 and weighted average of 97.1%, a difference of 0.39%.
Choctaw vs Ugandan 6th Grade

6th Grade Correlation Summary

MeasurementChoctawUgandan
Minimum94.7%95.4%
Maximum100.0%100.0%
Range5.3%4.6%
Mean98.6%98.2%
Median98.8%98.2%
Interquartile 25% (IQ1)98.0%97.4%
Interquartile 75% (IQ3)99.5%99.1%
Interquartile Range (IQR)1.5%1.7%
Standard Deviation (Sample)1.1%1.2%
Standard Deviation (Population)1.1%1.2%

Similar Demographics by 6th Grade

Demographics Similar to Choctaw by 6th Grade

In terms of 6th grade, the demographic groups most similar to Choctaw are Bhutanese (97.5%, a difference of 0.0%), German Russian (97.5%, a difference of 0.0%), Cheyenne (97.5%, a difference of 0.010%), Menominee (97.5%, a difference of 0.010%), and Turkish (97.5%, a difference of 0.020%).
DemographicsRating | Rank6th Grade
Immigrants | Ireland
98.7
/100
|
#95
Exceptional
97.5%
Immigrants | Germany
98.6
/100
|
#96
Exceptional
97.5%
Immigrants | Sweden
98.6
/100
|
#97
Exceptional
97.5%
Immigrants | Denmark
98.5
/100
|
#98
Exceptional
97.5%
Yugoslavians
98.5
/100
|
#99
Exceptional
97.5%
Turks
98.3
/100
|
#100
Exceptional
97.5%
South Africans
98.2
/100
|
#101
Exceptional
97.5%
Choctaw
98.0
/100
|
#102
Exceptional
97.5%
Bhutanese
98.0
/100
|
#103
Exceptional
97.5%
German Russians
97.9
/100
|
#104
Exceptional
97.5%
Cheyenne
97.9
/100
|
#105
Exceptional
97.5%
Menominee
97.7
/100
|
#106
Exceptional
97.5%
Immigrants | Singapore
97.6
/100
|
#107
Exceptional
97.5%
Immigrants | Nonimmigrants
97.3
/100
|
#108
Exceptional
97.4%
Immigrants | Czechoslovakia
97.3
/100
|
#109
Exceptional
97.4%

Demographics Similar to Ugandans by 6th Grade

In terms of 6th grade, the demographic groups most similar to Ugandans are Kenyan (97.1%, a difference of 0.0%), Immigrants from Iran (97.1%, a difference of 0.010%), Immigrants from Belarus (97.1%, a difference of 0.010%), Marshallese (97.1%, a difference of 0.010%), and Albanian (97.1%, a difference of 0.020%).
DemographicsRating | Rank6th Grade
Immigrants | Eastern Europe
72.6
/100
|
#153
Good
97.2%
Soviet Union
71.5
/100
|
#154
Good
97.2%
Ute
71.1
/100
|
#155
Good
97.1%
Alsatians
69.8
/100
|
#156
Good
97.1%
Immigrants | Russia
67.6
/100
|
#157
Good
97.1%
Immigrants | Iran
63.3
/100
|
#158
Good
97.1%
Kenyans
62.9
/100
|
#159
Good
97.1%
Ugandans
62.2
/100
|
#160
Good
97.1%
Immigrants | Belarus
60.4
/100
|
#161
Good
97.1%
Marshallese
60.2
/100
|
#162
Good
97.1%
Albanians
57.8
/100
|
#163
Average
97.1%
Immigrants | Korea
57.7
/100
|
#164
Average
97.1%
Immigrants | Poland
56.2
/100
|
#165
Average
97.1%
Immigrants | Italy
53.8
/100
|
#166
Average
97.1%
Apache
53.6
/100
|
#167
Average
97.1%