Chinese vs Venezuelan Master's Degree
COMPARE
Chinese
Venezuelan
Master's Degree
Master's Degree Comparison
Chinese
Venezuelans
14.6%
MASTER'S DEGREE
32.5/ 100
METRIC RATING
194th/ 347
METRIC RANK
15.9%
MASTER'S DEGREE
88.4/ 100
METRIC RATING
134th/ 347
METRIC RANK
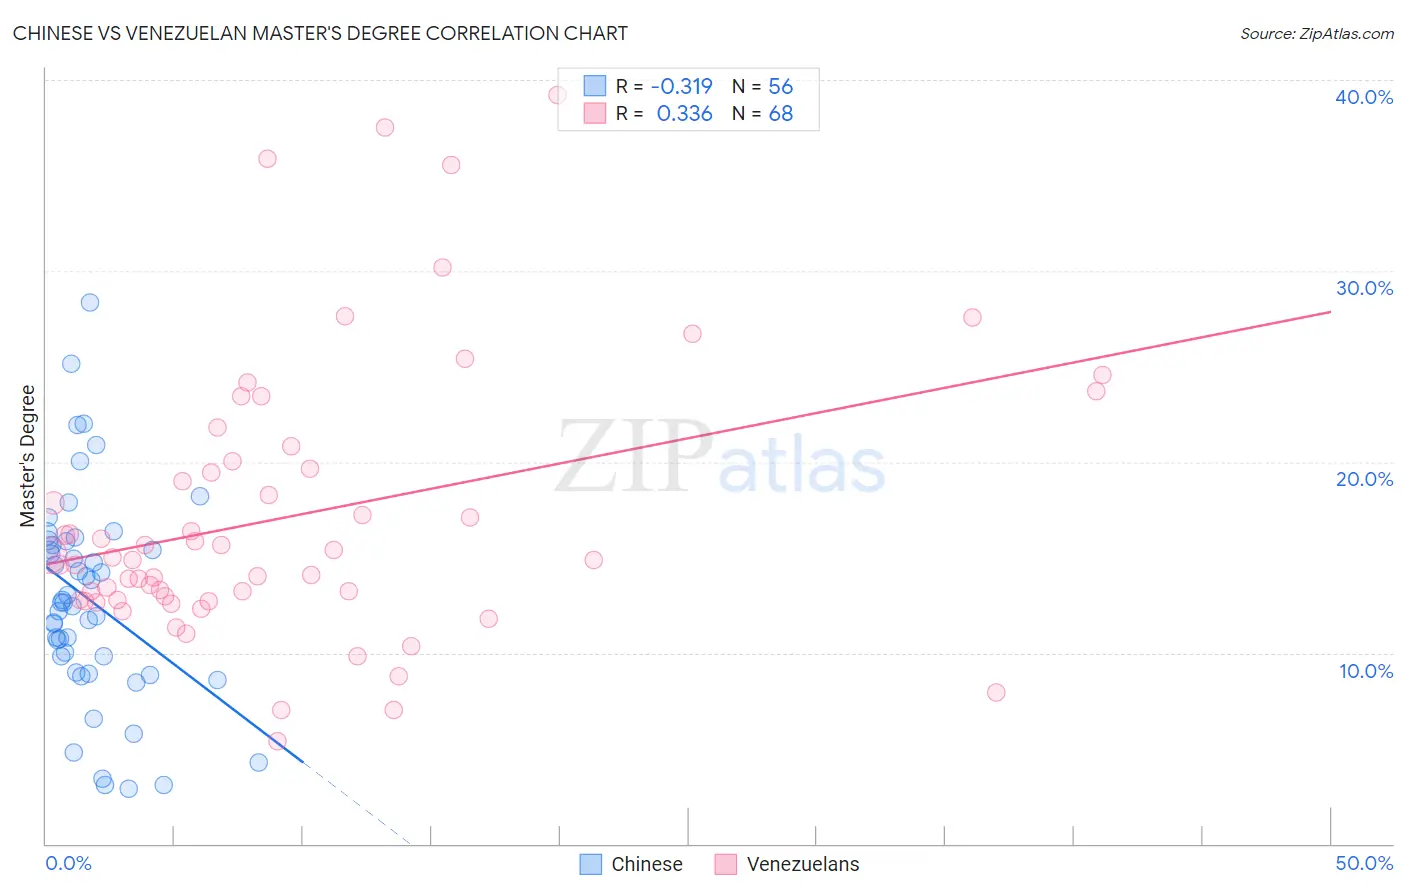
Chinese vs Venezuelan Master's Degree Correlation Chart
The statistical analysis conducted on geographies consisting of 64,806,468 people shows a mild negative correlation between the proportion of Chinese and percentage of population with at least master's degree education in the United States with a correlation coefficient (R) of -0.319 and weighted average of 14.6%. Similarly, the statistical analysis conducted on geographies consisting of 306,249,959 people shows a mild positive correlation between the proportion of Venezuelans and percentage of population with at least master's degree education in the United States with a correlation coefficient (R) of 0.336 and weighted average of 15.9%, a difference of 9.1%.
Master's Degree Correlation Summary
| Measurement | Chinese | Venezuelan |
| Minimum | 2.9% | 5.4% |
| Maximum | 28.4% | 39.2% |
| Range | 25.5% | 33.8% |
| Mean | 12.8% | 17.1% |
| Median | 12.6% | 14.9% |
| Interquartile 25% (IQ1) | 9.4% | 12.8% |
| Interquartile 75% (IQ3) | 15.7% | 19.8% |
| Interquartile Range (IQR) | 6.3% | 7.1% |
| Standard Deviation (Sample) | 5.4% | 7.2% |
| Standard Deviation (Population) | 5.3% | 7.2% |
Similar Demographics by Master's Degree
Demographics Similar to Chinese by Master's Degree
In terms of master's degree, the demographic groups most similar to Chinese are Immigrants from Nigeria (14.6%, a difference of 0.040%), Immigrants from Middle Africa (14.6%, a difference of 0.17%), Danish (14.5%, a difference of 0.18%), Welsh (14.6%, a difference of 0.26%), and Czechoslovakian (14.5%, a difference of 0.39%).
| Demographics | Rating | Rank | Master's Degree |
| Basques | 36.5 /100 | #187 | Fair 14.7% |
| Immigrants | Costa Rica | 36.2 /100 | #188 | Fair 14.7% |
| Immigrants | Immigrants | 36.0 /100 | #189 | Fair 14.6% |
| Spaniards | 35.8 /100 | #190 | Fair 14.6% |
| Welsh | 34.2 /100 | #191 | Fair 14.6% |
| Immigrants | Middle Africa | 33.6 /100 | #192 | Fair 14.6% |
| Immigrants | Nigeria | 32.7 /100 | #193 | Fair 14.6% |
| Chinese | 32.5 /100 | #194 | Fair 14.6% |
| Danes | 31.3 /100 | #195 | Fair 14.5% |
| Czechoslovakians | 29.9 /100 | #196 | Fair 14.5% |
| Belgians | 28.0 /100 | #197 | Fair 14.5% |
| West Indians | 27.4 /100 | #198 | Fair 14.5% |
| Immigrants | Armenia | 27.2 /100 | #199 | Fair 14.5% |
| Panamanians | 25.1 /100 | #200 | Fair 14.4% |
| Scotch-Irish | 25.0 /100 | #201 | Fair 14.4% |
Demographics Similar to Venezuelans by Master's Degree
In terms of master's degree, the demographic groups most similar to Venezuelans are South American Indian (15.9%, a difference of 0.0%), Assyrian/Chaldean/Syriac (15.8%, a difference of 0.45%), Immigrants from Sudan (16.0%, a difference of 0.56%), European (15.8%, a difference of 0.56%), and Pakistani (15.8%, a difference of 0.64%).
| Demographics | Rating | Rank | Master's Degree |
| Palestinians | 94.8 /100 | #127 | Exceptional 16.3% |
| Immigrants | Sierra Leone | 94.7 /100 | #128 | Exceptional 16.3% |
| Immigrants | Syria | 93.3 /100 | #129 | Exceptional 16.2% |
| Immigrants | Jordan | 92.7 /100 | #130 | Exceptional 16.1% |
| Taiwanese | 91.9 /100 | #131 | Exceptional 16.1% |
| Serbians | 91.7 /100 | #132 | Exceptional 16.1% |
| Immigrants | Sudan | 90.2 /100 | #133 | Exceptional 16.0% |
| Venezuelans | 88.4 /100 | #134 | Excellent 15.9% |
| South American Indians | 88.4 /100 | #135 | Excellent 15.9% |
| Assyrians/Chaldeans/Syriacs | 86.8 /100 | #136 | Excellent 15.8% |
| Europeans | 86.4 /100 | #137 | Excellent 15.8% |
| Pakistanis | 86.1 /100 | #138 | Excellent 15.8% |
| Immigrants | Germany | 85.9 /100 | #139 | Excellent 15.8% |
| Vietnamese | 85.5 /100 | #140 | Excellent 15.8% |
| Poles | 85.0 /100 | #141 | Excellent 15.7% |