Chilean vs Immigrants from Haiti 5th Grade
COMPARE
Chilean
Immigrants from Haiti
5th Grade
5th Grade Comparison
Chileans
Immigrants from Haiti
97.3%
5TH GRADE
54.5/ 100
METRIC RATING
168th/ 347
METRIC RANK
96.0%
5TH GRADE
0.0/ 100
METRIC RATING
306th/ 347
METRIC RANK
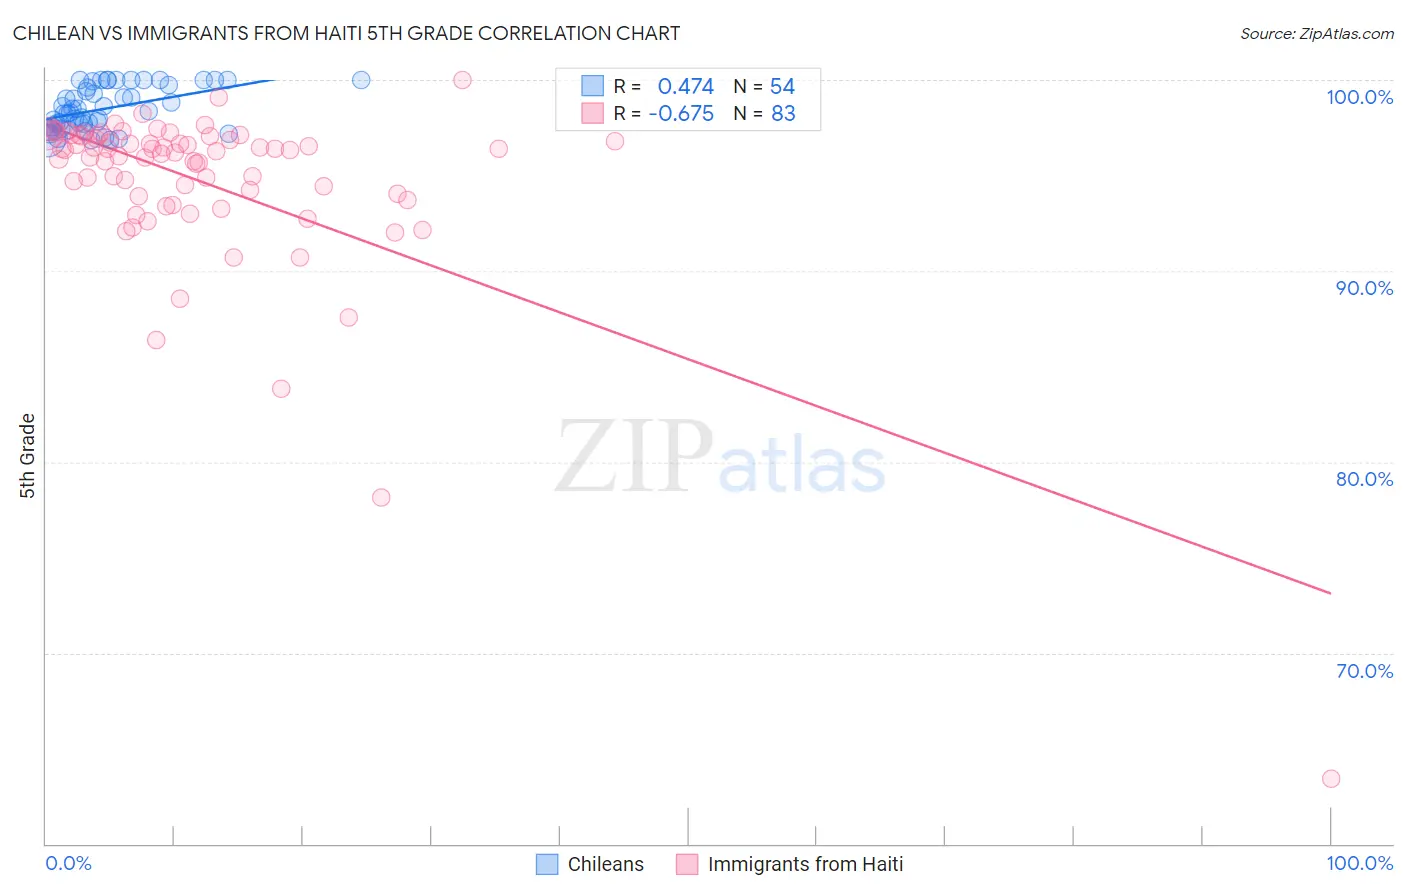
Chilean vs Immigrants from Haiti 5th Grade Correlation Chart
The statistical analysis conducted on geographies consisting of 256,683,580 people shows a moderate positive correlation between the proportion of Chileans and percentage of population with at least 5th grade education in the United States with a correlation coefficient (R) of 0.474 and weighted average of 97.3%. Similarly, the statistical analysis conducted on geographies consisting of 225,286,718 people shows a significant negative correlation between the proportion of Immigrants from Haiti and percentage of population with at least 5th grade education in the United States with a correlation coefficient (R) of -0.675 and weighted average of 96.0%, a difference of 1.4%.
5th Grade Correlation Summary
| Measurement | Chilean | Immigrants from Haiti |
| Minimum | 96.8% | 63.4% |
| Maximum | 100.0% | 100.0% |
| Range | 3.2% | 36.6% |
| Mean | 98.5% | 94.7% |
| Median | 98.3% | 96.2% |
| Interquartile 25% (IQ1) | 97.5% | 93.9% |
| Interquartile 75% (IQ3) | 99.8% | 97.0% |
| Interquartile Range (IQR) | 2.2% | 3.1% |
| Standard Deviation (Sample) | 1.1% | 4.8% |
| Standard Deviation (Population) | 1.1% | 4.8% |
Similar Demographics by 5th Grade
Demographics Similar to Chileans by 5th Grade
In terms of 5th grade, the demographic groups most similar to Chileans are Immigrants from Belarus (97.3%, a difference of 0.0%), Immigrants from Korea (97.3%, a difference of 0.0%), Venezuelan (97.3%, a difference of 0.0%), Immigrants from Sri Lanka (97.3%, a difference of 0.0%), and Arab (97.3%, a difference of 0.0%).
| Demographics | Rating | Rank | 5th Grade |
| Kenyans | 59.7 /100 | #161 | Average 97.4% |
| Immigrants | Iran | 59.5 /100 | #162 | Average 97.4% |
| Ugandans | 58.9 /100 | #163 | Average 97.4% |
| Bermudans | 58.8 /100 | #164 | Average 97.4% |
| Immigrants | Poland | 57.9 /100 | #165 | Average 97.4% |
| Apache | 57.2 /100 | #166 | Average 97.4% |
| Immigrants | Belarus | 54.6 /100 | #167 | Average 97.3% |
| Chileans | 54.5 /100 | #168 | Average 97.3% |
| Immigrants | Korea | 54.1 /100 | #169 | Average 97.3% |
| Venezuelans | 54.0 /100 | #170 | Average 97.3% |
| Immigrants | Sri Lanka | 53.8 /100 | #171 | Average 97.3% |
| Arabs | 53.4 /100 | #172 | Average 97.3% |
| Egyptians | 52.4 /100 | #173 | Average 97.3% |
| Immigrants | Kazakhstan | 50.0 /100 | #174 | Average 97.3% |
| Immigrants | Micronesia | 48.8 /100 | #175 | Average 97.3% |
Demographics Similar to Immigrants from Haiti by 5th Grade
In terms of 5th grade, the demographic groups most similar to Immigrants from Haiti are Immigrants from Caribbean (96.0%, a difference of 0.0%), Immigrants from Laos (96.0%, a difference of 0.010%), Ecuadorian (96.0%, a difference of 0.010%), Immigrants from Guyana (96.0%, a difference of 0.020%), and Immigrants from Burma/Myanmar (96.1%, a difference of 0.030%).
| Demographics | Rating | Rank | 5th Grade |
| Immigrants | Immigrants | 0.0 /100 | #299 | Tragic 96.2% |
| Sri Lankans | 0.0 /100 | #300 | Tragic 96.1% |
| Immigrants | Cuba | 0.0 /100 | #301 | Tragic 96.1% |
| Guyanese | 0.0 /100 | #302 | Tragic 96.1% |
| Puerto Ricans | 0.0 /100 | #303 | Tragic 96.1% |
| Immigrants | Burma/Myanmar | 0.0 /100 | #304 | Tragic 96.1% |
| Immigrants | Laos | 0.0 /100 | #305 | Tragic 96.0% |
| Immigrants | Haiti | 0.0 /100 | #306 | Tragic 96.0% |
| Immigrants | Caribbean | 0.0 /100 | #307 | Tragic 96.0% |
| Ecuadorians | 0.0 /100 | #308 | Tragic 96.0% |
| Immigrants | Guyana | 0.0 /100 | #309 | Tragic 96.0% |
| Indonesians | 0.0 /100 | #310 | Tragic 96.0% |
| Immigrants | Bangladesh | 0.0 /100 | #311 | Tragic 96.0% |
| Vietnamese | 0.0 /100 | #312 | Tragic 95.9% |
| Bangladeshis | 0.0 /100 | #313 | Tragic 95.9% |