Cheyenne vs Immigrants from Haiti Kindergarten

COMPARE

Cheyenne
Race
Ancestry
AfghanAfricanAlaska NativeAlaskan AthabascanAlbanianAleutAlsatianAmericanApacheArabArapahoArgentineanArmenianAssyrian/Chaldean/SyriacAustralianAustrianBahamianBangladeshiBarbadianBasqueBelgianBelizeanBermudanBhutaneseBlackfeetBolivianBrazilianBritishBritish West IndianBulgarianBurmeseCajunCambodianCanadianCape VerdeanCarpatho RusynCelticCentral AmericanCentral American IndianCherokeeCheyenneChickasawChileanChineseChippewaChoctawColombianColvilleComancheCosta RicanCreeCreekCroatianCrowCubanCypriotCzechCzechoslovakianDanishDelawareDominicanDutchDutch West IndianEastern EuropeanEcuadorianEgyptianEnglishEstonianEthiopianEuropeanFijianFilipinoFinnishFrenchFrench American IndianFrench CanadianGermanGerman RussianGhanaianGreekGuamanian/ChamorroGuatemalanGuyaneseHaitianHmongHonduranHopiHoumaHungarianIcelanderIndian (Asian)IndonesianInupiatIranianIraqiIrishIroquoisIsraeliItalianJamaicanJapaneseJordanianKenyanKiowaKoreanLaotianLatvianLebaneseLiberianLithuanianLumbeeLuxembourgerMacedonianMalaysianMalteseMarshalleseMenomineeMexicanMexican American IndianMongolianMoroccanNative HawaiianNavajoNepaleseNew ZealanderNicaraguanNigerianNorthern EuropeanNorwegianOkinawanOsageOttawaPaiutePakistaniPalestinianPanamanianParaguayanPennsylvania GermanPeruvianPimaPolishPortuguesePotawatomiPuebloPuerto RicanPuget Sound SalishRomanianRussianSalvadoranSamoanScandinavianScotch-IrishScottishSeminoleSenegaleseSerbianShoshoneSierra LeoneanSiouxSlavicSlovakSloveneSomaliSouth AfricanSouth AmericanSouth American IndianSoviet UnionSpaniardSpanishSpanish AmericanSpanish American IndianSri LankanSubsaharan AfricanSudaneseSwedishSwissSyrianTaiwaneseThaiTlingit-HaidaTohono O'OdhamTonganTrinidadian and TobagonianTsimshianTurkishU.S. Virgin IslanderUgandanUkrainianUruguayanUteVenezuelanVietnameseWelshWest IndianYakamaYaquiYugoslavianYumanYup'ikZimbabwean
Immigration
NonimmigrantsImmigrantsAfghanistanAfricaAlbaniaArgentinaArmeniaAsiaAustraliaAustriaBahamasBangladeshBarbadosBelarusBelgiumBelizeBoliviaBosnia and HerzegovinaBrazilBulgariaBurma/MyanmarCabo VerdeCambodiaCameroonCanadaCaribbeanCentral AmericaChileChinaColombiaCongoCosta RicaCroatiaCubaCzechoslovakiaDenmarkDominicaDominican RepublicEastern AfricaEastern AsiaEastern EuropeEcuadorEgyptEl SalvadorEnglandEritreaEthiopiaEuropeFijiFranceGermanyGhanaGreeceGrenadaGuatemalaGuyanaHondurasHong KongHungaryIndiaIndonesiaIranIraqIrelandIsraelItalyJamaicaJapanJordanKazakhstanKenyaKoreaKuwaitLaosLatin AmericaLatviaLebanonLiberiaLithuaniaMalaysiaMexicoMicronesiaMiddle AfricaMoldovaMoroccoNepalNetherlandsNicaraguaNigeriaNorth AmericaNorth MacedoniaNorthern AfricaNorthern EuropeNorwayOceaniaPakistanPanamaPeruPhilippinesPolandPortugalRomaniaRussiaSaudi ArabiaScotlandSenegalSerbiaSierra LeoneSingaporeSomaliaSouth AfricaSouth AmericaSouth Central AsiaSouth Eastern AsiaSouthern EuropeSpainSri LankaSt. Vincent and the GrenadinesSudanSwedenSwitzerlandSyriaTaiwanThailandTrinidad and TobagoTurkeyUgandaUkraineUruguayUzbekistanVenezuelaVietnamWest IndiesWestern AfricaWestern AsiaWestern EuropeYemenZaireZimbabweAzores
Immigrants from Haiti
Race
Ancestry
AfghanAfricanAlaska NativeAlaskan AthabascanAlbanianAleutAlsatianAmericanApacheArabArapahoArgentineanArmenianAssyrian/Chaldean/SyriacAustralianAustrianBahamianBangladeshiBarbadianBasqueBelgianBelizeanBermudanBhutaneseBlackfeetBolivianBrazilianBritishBritish West IndianBulgarianBurmeseCajunCambodianCanadianCape VerdeanCarpatho RusynCelticCentral AmericanCentral American IndianCherokeeChickasawChileanChineseChippewaChoctawColombianColvilleComancheCosta RicanCreeCreekCroatianCrowCubanCypriotCzechCzechoslovakianDanishDelawareDominicanDutchDutch West IndianEastern EuropeanEcuadorianEgyptianEnglishEstonianEthiopianEuropeanFijianFilipinoFinnishFrenchFrench American IndianFrench CanadianGermanGerman RussianGhanaianGreekGuamanian/ChamorroGuatemalanGuyaneseHaitianHmongHonduranHopiHoumaHungarianIcelanderIndian (Asian)IndonesianInupiatIranianIraqiIrishIroquoisIsraeliItalianJamaicanJapaneseJordanianKenyanKiowaKoreanLaotianLatvianLebaneseLiberianLithuanianLumbeeLuxembourgerMacedonianMalaysianMalteseMarshalleseMenomineeMexicanMexican American IndianMongolianMoroccanNative HawaiianNavajoNepaleseNew ZealanderNicaraguanNigerianNorthern EuropeanNorwegianOkinawanOsageOttawaPaiutePakistaniPalestinianPanamanianParaguayanPennsylvania GermanPeruvianPimaPolishPortuguesePotawatomiPuebloPuerto RicanPuget Sound SalishRomanianRussianSalvadoranSamoanScandinavianScotch-IrishScottishSeminoleSenegaleseSerbianShoshoneSierra LeoneanSiouxSlavicSlovakSloveneSomaliSouth AfricanSouth AmericanSouth American IndianSoviet UnionSpaniardSpanishSpanish AmericanSpanish American IndianSri LankanSubsaharan AfricanSudaneseSwedishSwissSyrianTaiwaneseThaiTlingit-HaidaTohono O'OdhamTonganTrinidadian and TobagonianTsimshianTurkishU.S. Virgin IslanderUgandanUkrainianUruguayanUteVenezuelanVietnameseWelshWest IndianYakamaYaquiYugoslavianYumanYup'ikZimbabwean
Immigration
NonimmigrantsImmigrantsAfghanistanAfricaAlbaniaArgentinaArmeniaAsiaAustraliaAustriaBahamasBangladeshBarbadosBelarusBelgiumBelizeBoliviaBosnia and HerzegovinaBrazilBulgariaBurma/MyanmarCabo VerdeCambodiaCameroonCanadaCaribbeanCentral AmericaChileChinaColombiaCongoCosta RicaCroatiaCubaCzechoslovakiaDenmarkDominicaDominican RepublicEastern AfricaEastern AsiaEastern EuropeEcuadorEgyptEl SalvadorEnglandEritreaEthiopiaEuropeFijiFranceGermanyGhanaGreeceGrenadaGuatemalaGuyanaHaitiHondurasHong KongHungaryIndiaIndonesiaIranIraqIrelandIsraelItalyJamaicaJapanJordanKazakhstanKenyaKoreaKuwaitLaosLatin AmericaLatviaLebanonLiberiaLithuaniaMalaysiaMexicoMicronesiaMiddle AfricaMoldovaMoroccoNepalNetherlandsNicaraguaNigeriaNorth AmericaNorth MacedoniaNorthern AfricaNorthern EuropeNorwayOceaniaPakistanPanamaPeruPhilippinesPolandPortugalRomaniaRussiaSaudi ArabiaScotlandSenegalSerbiaSierra LeoneSingaporeSomaliaSouth AfricaSouth AmericaSouth Central AsiaSouth Eastern AsiaSouthern EuropeSpainSri LankaSt. Vincent and the GrenadinesSudanSwedenSwitzerlandSyriaTaiwanThailandTrinidad and TobagoTurkeyUgandaUkraineUruguayUzbekistanVenezuelaVietnamWest IndiesWestern AfricaWestern AsiaWestern EuropeYemenZaireZimbabweAzores
Kindergarten
Income
Poverty
Unemployment
Labor Participation
Family Structure
Vehicle Availability
Education Level
Disability

Kindergarten Comparison

Cheyenne

Immigrants from Haiti

Exceptional
Tragic
98.4%
KINDERGARTEN
99.6/ 100
METRIC RATING
66th/ 347
METRIC RANK
97.0%
KINDERGARTEN
0.0/ 100
METRIC RATING
309th/ 347
METRIC RANK

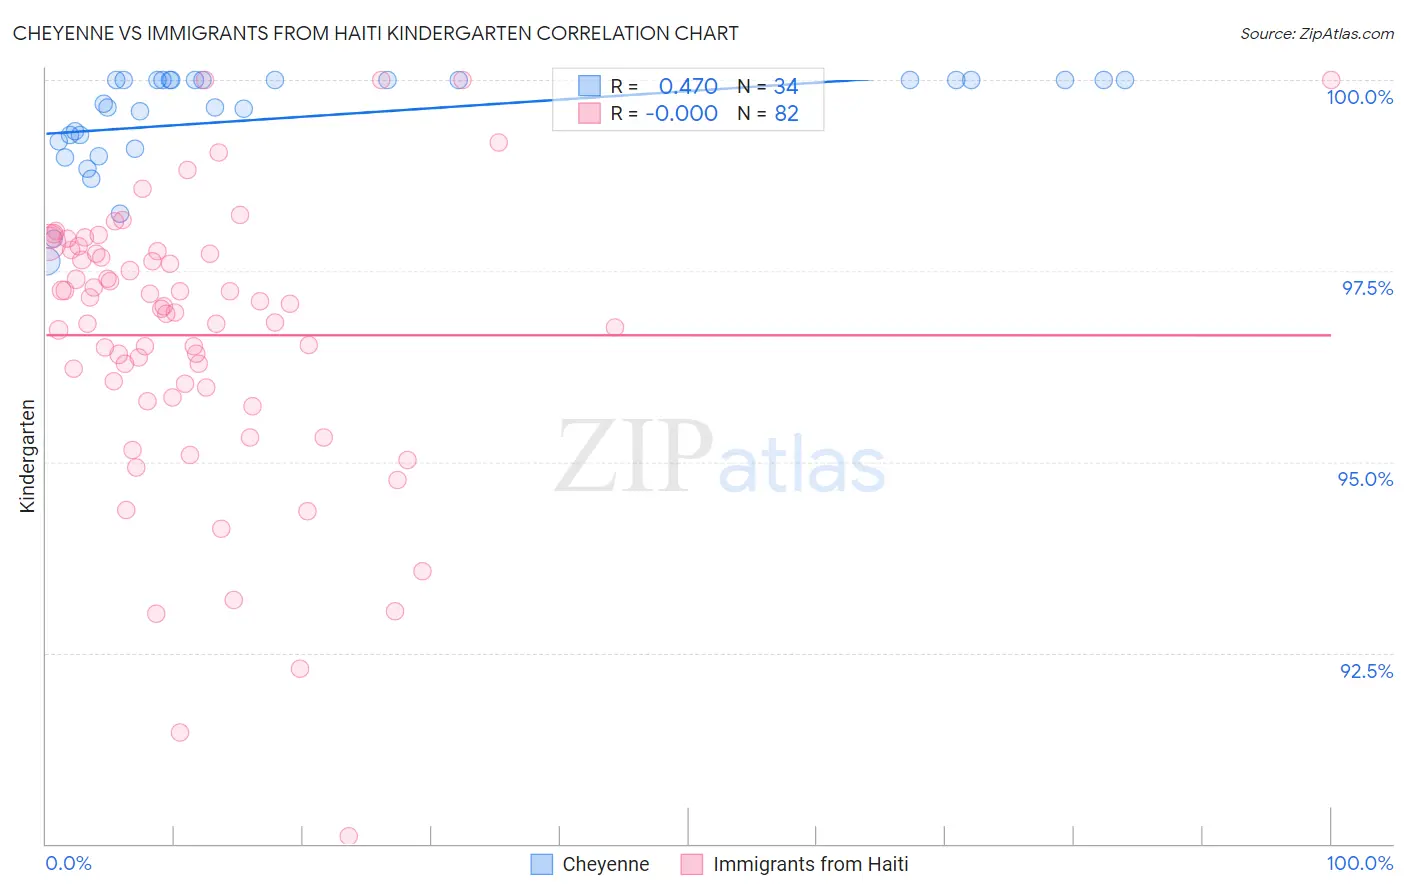
Cheyenne vs Immigrants from Haiti Kindergarten Correlation Chart

The statistical analysis conducted on geographies consisting of 80,719,411 people shows a moderate positive correlation between the proportion of Cheyenne and percentage of population with at least kindergarten education in the United States with a correlation coefficient (R) of 0.470 and weighted average of 98.4%. Similarly, the statistical analysis conducted on geographies consisting of 225,286,614 people shows no correlation between the proportion of Immigrants from Haiti and percentage of population with at least kindergarten education in the United States with a correlation coefficient (R) of -0.000 and weighted average of 97.0%, a difference of 1.5%.
Cheyenne vs Immigrants from Haiti Kindergarten

Kindergarten Correlation Summary

MeasurementCheyenneImmigrants from Haiti
Minimum97.6%90.1%
Maximum100.0%100.0%
Range2.4%9.9%
Mean99.5%96.7%
Median99.8%97.0%
Interquartile 25% (IQ1)99.2%96.0%
Interquartile 75% (IQ3)100.0%97.8%
Interquartile Range (IQR)0.79%1.8%
Standard Deviation (Sample)0.65%1.8%
Standard Deviation (Population)0.64%1.8%

Similar Demographics by Kindergarten

Demographics Similar to Cheyenne by Kindergarten

In terms of kindergarten, the demographic groups most similar to Cheyenne are Canadian (98.4%, a difference of 0.0%), Immigrants from Northern Europe (98.4%, a difference of 0.0%), Maltese (98.4%, a difference of 0.010%), Immigrants from Austria (98.4%, a difference of 0.010%), and Russian (98.4%, a difference of 0.010%).
DemographicsRating | RankKindergarten
Immigrants | Canada
99.7
/100
|
#59
Exceptional
98.4%
Creek
99.7
/100
|
#60
Exceptional
98.4%
Slavs
99.7
/100
|
#61
Exceptional
98.4%
New Zealanders
99.7
/100
|
#62
Exceptional
98.4%
Immigrants | North America
99.7
/100
|
#63
Exceptional
98.4%
Greeks
99.7
/100
|
#64
Exceptional
98.4%
Maltese
99.7
/100
|
#65
Exceptional
98.4%
Cheyenne
99.6
/100
|
#66
Exceptional
98.4%
Canadians
99.6
/100
|
#67
Exceptional
98.4%
Immigrants | Northern Europe
99.6
/100
|
#68
Exceptional
98.4%
Immigrants | Austria
99.6
/100
|
#69
Exceptional
98.4%
Russians
99.6
/100
|
#70
Exceptional
98.4%
Chickasaw
99.6
/100
|
#71
Exceptional
98.4%
Serbians
99.6
/100
|
#72
Exceptional
98.4%
Cajuns
99.4
/100
|
#73
Exceptional
98.3%

Demographics Similar to Immigrants from Haiti by Kindergarten

In terms of kindergarten, the demographic groups most similar to Immigrants from Haiti are Immigrants from Somalia (97.0%, a difference of 0.0%), Immigrants from the Azores (97.0%, a difference of 0.0%), Hispanic or Latino (97.0%, a difference of 0.010%), Sri Lankan (97.0%, a difference of 0.010%), and Belizean (97.0%, a difference of 0.020%).
DemographicsRating | RankKindergarten
Immigrants | Caribbean
0.0
/100
|
#302
Tragic
97.1%
Somalis
0.0
/100
|
#303
Tragic
97.0%
Nicaraguans
0.0
/100
|
#304
Tragic
97.0%
Ecuadorians
0.0
/100
|
#305
Tragic
97.0%
Belizeans
0.0
/100
|
#306
Tragic
97.0%
Hispanics or Latinos
0.0
/100
|
#307
Tragic
97.0%
Immigrants | Somalia
0.0
/100
|
#308
Tragic
97.0%
Immigrants | Haiti
0.0
/100
|
#309
Tragic
97.0%
Immigrants | Azores
0.0
/100
|
#310
Tragic
97.0%
Sri Lankans
0.0
/100
|
#311
Tragic
97.0%
Guyanese
0.0
/100
|
#312
Tragic
96.9%
Cape Verdeans
0.0
/100
|
#313
Tragic
96.9%
Hondurans
0.0
/100
|
#314
Tragic
96.9%
Immigrants | Belize
0.0
/100
|
#315
Tragic
96.9%
Immigrants | Nicaragua
0.0
/100
|
#316
Tragic
96.9%