Cheyenne vs Ghanaian 8th Grade
COMPARE
Cheyenne
Ghanaian
8th Grade
8th Grade Comparison
Cheyenne
Ghanaians
96.1%
8TH GRADE
93.3/ 100
METRIC RATING
129th/ 347
METRIC RANK
94.9%
8TH GRADE
0.6/ 100
METRIC RATING
259th/ 347
METRIC RANK
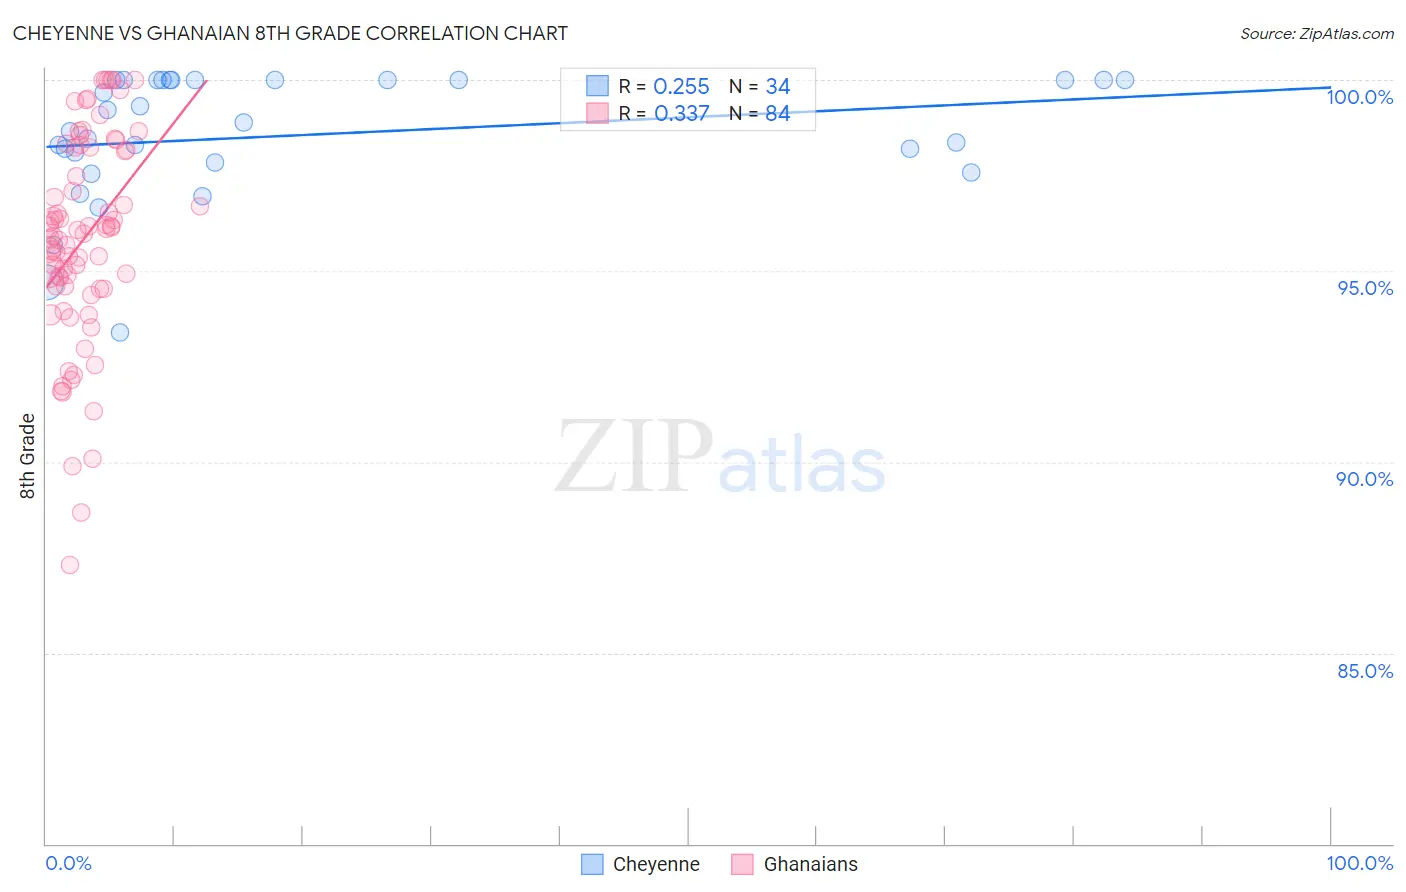
Cheyenne vs Ghanaian 8th Grade Correlation Chart
The statistical analysis conducted on geographies consisting of 80,719,411 people shows a weak positive correlation between the proportion of Cheyenne and percentage of population with at least 8th grade education in the United States with a correlation coefficient (R) of 0.255 and weighted average of 96.1%. Similarly, the statistical analysis conducted on geographies consisting of 190,712,873 people shows a mild positive correlation between the proportion of Ghanaians and percentage of population with at least 8th grade education in the United States with a correlation coefficient (R) of 0.337 and weighted average of 94.9%, a difference of 1.3%.
8th Grade Correlation Summary
| Measurement | Cheyenne | Ghanaian |
| Minimum | 93.4% | 87.3% |
| Maximum | 100.0% | 100.0% |
| Range | 6.6% | 12.7% |
| Mean | 98.6% | 95.8% |
| Median | 98.8% | 96.0% |
| Interquartile 25% (IQ1) | 97.8% | 94.6% |
| Interquartile 75% (IQ3) | 100.0% | 98.2% |
| Interquartile Range (IQR) | 2.2% | 3.6% |
| Standard Deviation (Sample) | 1.7% | 2.7% |
| Standard Deviation (Population) | 1.6% | 2.7% |
Similar Demographics by 8th Grade
Demographics Similar to Cheyenne by 8th Grade
In terms of 8th grade, the demographic groups most similar to Cheyenne are Immigrants from Bosnia and Herzegovina (96.2%, a difference of 0.010%), Immigrants from Romania (96.2%, a difference of 0.020%), Choctaw (96.2%, a difference of 0.020%), Immigrants from Serbia (96.2%, a difference of 0.020%), and Soviet Union (96.1%, a difference of 0.020%).
| Demographics | Rating | Rank | 8th Grade |
| Immigrants | Europe | 95.3 /100 | #122 | Exceptional 96.2% |
| Filipinos | 94.6 /100 | #123 | Exceptional 96.2% |
| Palestinians | 94.6 /100 | #124 | Exceptional 96.2% |
| Immigrants | Romania | 94.1 /100 | #125 | Exceptional 96.2% |
| Choctaw | 94.0 /100 | #126 | Exceptional 96.2% |
| Immigrants | Serbia | 94.0 /100 | #127 | Exceptional 96.2% |
| Immigrants | Bosnia and Herzegovina | 93.9 /100 | #128 | Exceptional 96.2% |
| Cheyenne | 93.3 /100 | #129 | Exceptional 96.1% |
| Soviet Union | 92.6 /100 | #130 | Exceptional 96.1% |
| Pueblo | 92.3 /100 | #131 | Exceptional 96.1% |
| Immigrants | Kuwait | 92.2 /100 | #132 | Exceptional 96.1% |
| Immigrants | Turkey | 91.7 /100 | #133 | Exceptional 96.1% |
| Immigrants | Hungary | 91.5 /100 | #134 | Exceptional 96.1% |
| Basques | 91.5 /100 | #135 | Exceptional 96.1% |
| Jordanians | 91.3 /100 | #136 | Exceptional 96.1% |
Demographics Similar to Ghanaians by 8th Grade
In terms of 8th grade, the demographic groups most similar to Ghanaians are Immigrants from Congo (94.9%, a difference of 0.0%), Immigrants from Jamaica (94.9%, a difference of 0.0%), Afghan (94.9%, a difference of 0.010%), Colombian (95.0%, a difference of 0.020%), and Immigrants from Somalia (95.0%, a difference of 0.030%).
| Demographics | Rating | Rank | 8th Grade |
| Immigrants | Ethiopia | 1.0 /100 | #252 | Tragic 95.0% |
| U.S. Virgin Islanders | 0.9 /100 | #253 | Tragic 95.0% |
| Immigrants | Cameroon | 0.8 /100 | #254 | Tragic 95.0% |
| Immigrants | Somalia | 0.7 /100 | #255 | Tragic 95.0% |
| Colombians | 0.7 /100 | #256 | Tragic 95.0% |
| Afghans | 0.6 /100 | #257 | Tragic 94.9% |
| Immigrants | Congo | 0.6 /100 | #258 | Tragic 94.9% |
| Ghanaians | 0.6 /100 | #259 | Tragic 94.9% |
| Immigrants | Jamaica | 0.6 /100 | #260 | Tragic 94.9% |
| Immigrants | Costa Rica | 0.5 /100 | #261 | Tragic 94.9% |
| Immigrants | Nigeria | 0.4 /100 | #262 | Tragic 94.9% |
| Immigrants | Hong Kong | 0.4 /100 | #263 | Tragic 94.9% |
| South Americans | 0.4 /100 | #264 | Tragic 94.9% |
| Yuman | 0.4 /100 | #265 | Tragic 94.9% |
| West Indians | 0.3 /100 | #266 | Tragic 94.8% |