Cherokee vs Arab 5th Grade

COMPARE

Cherokee
Race
Ancestry
AfghanAfricanAlaska NativeAlaskan AthabascanAlbanianAleutAlsatianAmericanApacheArapahoArgentineanArmenianAssyrian/Chaldean/SyriacAustralianAustrianBahamianBangladeshiBarbadianBasqueBelgianBelizeanBermudanBhutaneseBlackfeetBolivianBrazilianBritishBritish West IndianBulgarianBurmeseCajunCambodianCanadianCape VerdeanCarpatho RusynCelticCentral AmericanCentral American IndianCherokeeCheyenneChickasawChileanChineseChippewaChoctawColombianColvilleComancheCosta RicanCreeCreekCroatianCrowCubanCypriotCzechCzechoslovakianDanishDelawareDominicanDutchDutch West IndianEastern EuropeanEcuadorianEgyptianEnglishEstonianEthiopianEuropeanFijianFilipinoFinnishFrenchFrench American IndianFrench CanadianGermanGerman RussianGhanaianGreekGuamanian/ChamorroGuatemalanGuyaneseHaitianHmongHonduranHopiHoumaHungarianIcelanderIndian (Asian)IndonesianInupiatIranianIraqiIrishIroquoisIsraeliItalianJamaicanJapaneseJordanianKenyanKiowaKoreanLaotianLatvianLebaneseLiberianLithuanianLumbeeLuxembourgerMacedonianMalaysianMalteseMarshalleseMenomineeMexicanMexican American IndianMongolianMoroccanNative HawaiianNavajoNepaleseNew ZealanderNicaraguanNigerianNorthern EuropeanNorwegianOkinawanOsageOttawaPaiutePakistaniPalestinianPanamanianParaguayanPennsylvania GermanPeruvianPimaPolishPortuguesePotawatomiPuebloPuerto RicanPuget Sound SalishRomanianRussianSalvadoranSamoanScandinavianScotch-IrishScottishSeminoleSenegaleseSerbianShoshoneSierra LeoneanSiouxSlavicSlovakSloveneSomaliSouth AfricanSouth AmericanSouth American IndianSoviet UnionSpaniardSpanishSpanish AmericanSpanish American IndianSri LankanSubsaharan AfricanSudaneseSwedishSwissSyrianTaiwaneseThaiTlingit-HaidaTohono O'OdhamTonganTrinidadian and TobagonianTsimshianTurkishU.S. Virgin IslanderUgandanUkrainianUruguayanUteVenezuelanVietnameseWelshWest IndianYakamaYaquiYugoslavianYumanYup'ikZimbabwean
Immigration
NonimmigrantsImmigrantsAfghanistanAfricaAlbaniaArgentinaArmeniaAsiaAustraliaAustriaBahamasBangladeshBarbadosBelarusBelgiumBelizeBoliviaBosnia and HerzegovinaBrazilBulgariaBurma/MyanmarCabo VerdeCambodiaCameroonCanadaCaribbeanCentral AmericaChileChinaColombiaCongoCosta RicaCroatiaCubaCzechoslovakiaDenmarkDominicaDominican RepublicEastern AfricaEastern AsiaEastern EuropeEcuadorEgyptEl SalvadorEnglandEritreaEthiopiaEuropeFijiFranceGermanyGhanaGreeceGrenadaGuatemalaGuyanaHaitiHondurasHong KongHungaryIndiaIndonesiaIranIraqIrelandIsraelItalyJamaicaJapanJordanKazakhstanKenyaKoreaKuwaitLaosLatin AmericaLatviaLebanonLiberiaLithuaniaMalaysiaMexicoMicronesiaMiddle AfricaMoldovaMoroccoNepalNetherlandsNicaraguaNigeriaNorth AmericaNorth MacedoniaNorthern AfricaNorthern EuropeNorwayOceaniaPakistanPanamaPeruPhilippinesPolandPortugalRomaniaRussiaSaudi ArabiaScotlandSenegalSerbiaSierra LeoneSingaporeSomaliaSouth AfricaSouth AmericaSouth Central AsiaSouth Eastern AsiaSouthern EuropeSpainSri LankaSt. Vincent and the GrenadinesSudanSwedenSwitzerlandSyriaTaiwanThailandTrinidad and TobagoTurkeyUgandaUkraineUruguayUzbekistanVenezuelaVietnamWest IndiesWestern AfricaWestern AsiaWestern EuropeYemenZaireZimbabweAzores
Arab
Race
Ancestry
AfghanAfricanAlaska NativeAlaskan AthabascanAlbanianAleutAlsatianAmericanApacheArabArapahoArgentineanArmenianAssyrian/Chaldean/SyriacAustralianAustrianBahamianBangladeshiBarbadianBasqueBelgianBelizeanBermudanBhutaneseBlackfeetBolivianBrazilianBritishBritish West IndianBulgarianBurmeseCajunCambodianCanadianCape VerdeanCarpatho RusynCelticCentral AmericanCentral American IndianCheyenneChickasawChileanChineseChippewaChoctawColombianColvilleComancheCosta RicanCreeCreekCroatianCrowCubanCypriotCzechCzechoslovakianDanishDelawareDominicanDutchDutch West IndianEastern EuropeanEcuadorianEgyptianEnglishEstonianEthiopianEuropeanFijianFilipinoFinnishFrenchFrench American IndianFrench CanadianGermanGerman RussianGhanaianGreekGuamanian/ChamorroGuatemalanGuyaneseHaitianHmongHonduranHopiHoumaHungarianIcelanderIndian (Asian)IndonesianInupiatIranianIraqiIrishIroquoisIsraeliItalianJamaicanJapaneseJordanianKenyanKiowaKoreanLaotianLatvianLebaneseLiberianLithuanianLumbeeLuxembourgerMacedonianMalaysianMalteseMarshalleseMenomineeMexicanMexican American IndianMongolianMoroccanNative HawaiianNavajoNepaleseNew ZealanderNicaraguanNigerianNorthern EuropeanNorwegianOkinawanOsageOttawaPaiutePakistaniPalestinianPanamanianParaguayanPennsylvania GermanPeruvianPimaPolishPortuguesePotawatomiPuebloPuerto RicanPuget Sound SalishRomanianRussianSalvadoranSamoanScandinavianScotch-IrishScottishSeminoleSenegaleseSerbianShoshoneSierra LeoneanSiouxSlavicSlovakSloveneSomaliSouth AfricanSouth AmericanSouth American IndianSoviet UnionSpaniardSpanishSpanish AmericanSpanish American IndianSri LankanSubsaharan AfricanSudaneseSwedishSwissSyrianTaiwaneseThaiTlingit-HaidaTohono O'OdhamTonganTrinidadian and TobagonianTsimshianTurkishU.S. Virgin IslanderUgandanUkrainianUruguayanUteVenezuelanVietnameseWelshWest IndianYakamaYaquiYugoslavianYumanYup'ikZimbabwean
Immigration
NonimmigrantsImmigrantsAfghanistanAfricaAlbaniaArgentinaArmeniaAsiaAustraliaAustriaBahamasBangladeshBarbadosBelarusBelgiumBelizeBoliviaBosnia and HerzegovinaBrazilBulgariaBurma/MyanmarCabo VerdeCambodiaCameroonCanadaCaribbeanCentral AmericaChileChinaColombiaCongoCosta RicaCroatiaCubaCzechoslovakiaDenmarkDominicaDominican RepublicEastern AfricaEastern AsiaEastern EuropeEcuadorEgyptEl SalvadorEnglandEritreaEthiopiaEuropeFijiFranceGermanyGhanaGreeceGrenadaGuatemalaGuyanaHaitiHondurasHong KongHungaryIndiaIndonesiaIranIraqIrelandIsraelItalyJamaicaJapanJordanKazakhstanKenyaKoreaKuwaitLaosLatin AmericaLatviaLebanonLiberiaLithuaniaMalaysiaMexicoMicronesiaMiddle AfricaMoldovaMoroccoNepalNetherlandsNicaraguaNigeriaNorth AmericaNorth MacedoniaNorthern AfricaNorthern EuropeNorwayOceaniaPakistanPanamaPeruPhilippinesPolandPortugalRomaniaRussiaSaudi ArabiaScotlandSenegalSerbiaSierra LeoneSingaporeSomaliaSouth AfricaSouth AmericaSouth Central AsiaSouth Eastern AsiaSouthern EuropeSpainSri LankaSt. Vincent and the GrenadinesSudanSwedenSwitzerlandSyriaTaiwanThailandTrinidad and TobagoTurkeyUgandaUkraineUruguayUzbekistanVenezuelaVietnamWest IndiesWestern AfricaWestern AsiaWestern EuropeYemenZaireZimbabweAzores
5th Grade
Income
Poverty
Unemployment
Labor Participation
Family Structure
Vehicle Availability
Education Level
Disability

5th Grade Comparison

Cherokee

Arabs

Exceptional
Average
97.8%
5TH GRADE
99.4/ 100
METRIC RATING
73rd/ 347
METRIC RANK
97.3%
5TH GRADE
53.4/ 100
METRIC RATING
172nd/ 347
METRIC RANK

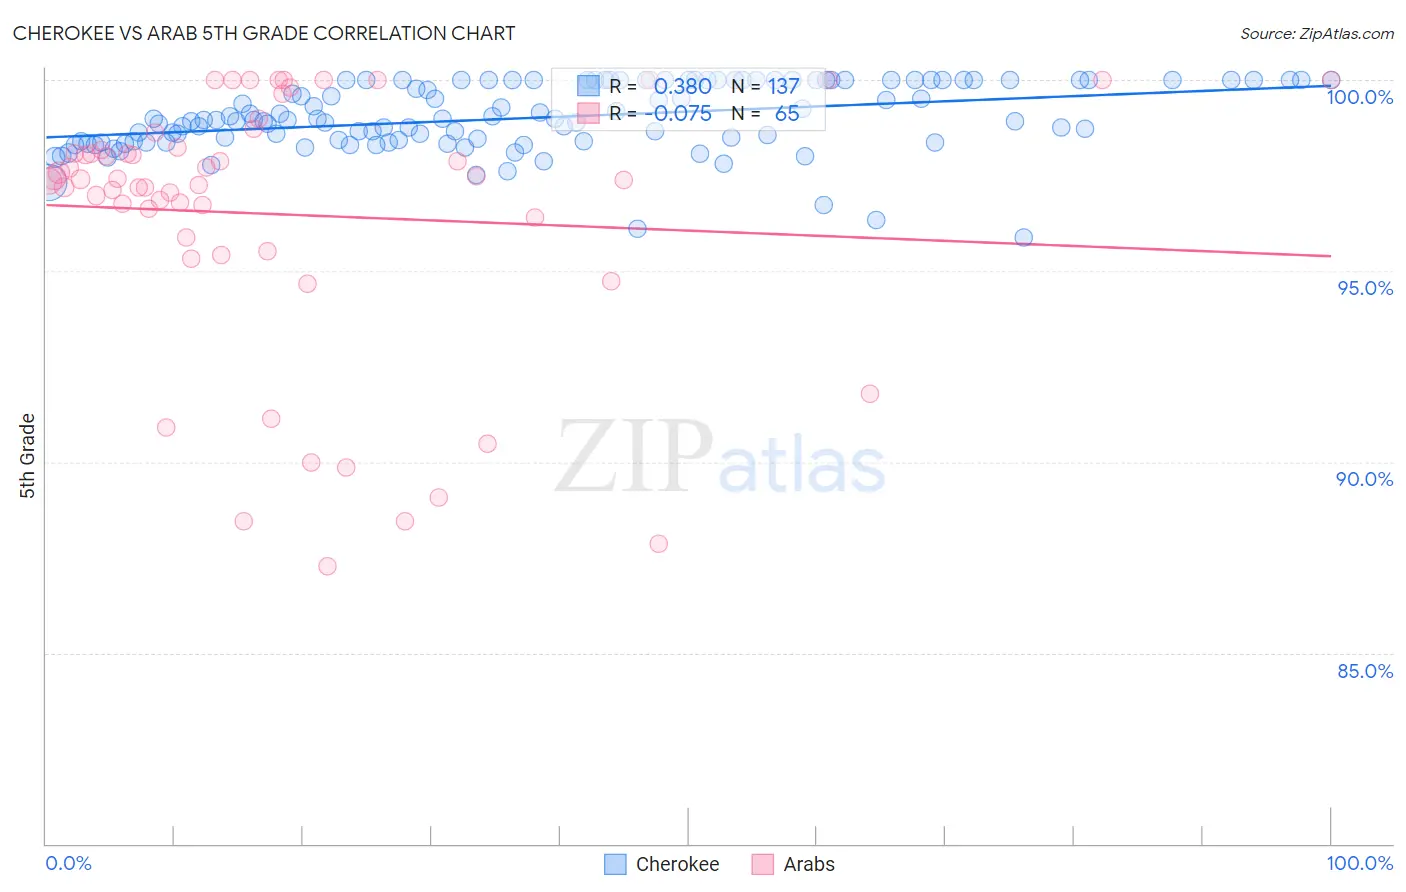
Cherokee vs Arab 5th Grade Correlation Chart

The statistical analysis conducted on geographies consisting of 493,719,253 people shows a mild positive correlation between the proportion of Cherokee and percentage of population with at least 5th grade education in the United States with a correlation coefficient (R) of 0.380 and weighted average of 97.8%. Similarly, the statistical analysis conducted on geographies consisting of 486,871,007 people shows a slight negative correlation between the proportion of Arabs and percentage of population with at least 5th grade education in the United States with a correlation coefficient (R) of -0.075 and weighted average of 97.3%, a difference of 0.51%.
Cherokee vs Arab 5th Grade

5th Grade Correlation Summary

MeasurementCherokeeArab
Minimum95.9%87.3%
Maximum100.0%100.0%
Range4.1%12.7%
Mean99.0%96.5%
Median98.9%97.4%
Interquartile 25% (IQ1)98.4%95.7%
Interquartile 75% (IQ3)100.0%98.4%
Interquartile Range (IQR)1.6%2.7%
Standard Deviation (Sample)0.89%3.5%
Standard Deviation (Population)0.88%3.4%

Similar Demographics by 5th Grade

Demographics Similar to Cherokee by 5th Grade

In terms of 5th grade, the demographic groups most similar to Cherokee are Lumbee (97.8%, a difference of 0.0%), Macedonian (97.9%, a difference of 0.010%), Ukrainian (97.8%, a difference of 0.010%), Immigrants from Netherlands (97.8%, a difference of 0.010%), and Immigrants from England (97.8%, a difference of 0.010%).
DemographicsRating | Rank5th Grade
Immigrants | Austria
99.6
/100
|
#66
Exceptional
97.9%
New Zealanders
99.6
/100
|
#67
Exceptional
97.9%
Cajuns
99.6
/100
|
#68
Exceptional
97.9%
Kiowa
99.5
/100
|
#69
Exceptional
97.9%
Iranians
99.5
/100
|
#70
Exceptional
97.9%
Chickasaw
99.5
/100
|
#71
Exceptional
97.9%
Macedonians
99.4
/100
|
#72
Exceptional
97.9%
Cherokee
99.4
/100
|
#73
Exceptional
97.8%
Lumbee
99.3
/100
|
#74
Exceptional
97.8%
Ukrainians
99.3
/100
|
#75
Exceptional
97.8%
Immigrants | Netherlands
99.3
/100
|
#76
Exceptional
97.8%
Immigrants | England
99.3
/100
|
#77
Exceptional
97.8%
Osage
99.3
/100
|
#78
Exceptional
97.8%
Immigrants | Lithuania
99.2
/100
|
#79
Exceptional
97.8%
Immigrants | India
99.2
/100
|
#80
Exceptional
97.8%

Demographics Similar to Arabs by 5th Grade

In terms of 5th grade, the demographic groups most similar to Arabs are Immigrants from Belarus (97.3%, a difference of 0.0%), Chilean (97.3%, a difference of 0.0%), Immigrants from Korea (97.3%, a difference of 0.0%), Venezuelan (97.3%, a difference of 0.0%), and Immigrants from Sri Lanka (97.3%, a difference of 0.0%).
DemographicsRating | Rank5th Grade
Immigrants | Poland
57.9
/100
|
#165
Average
97.4%
Apache
57.2
/100
|
#166
Average
97.4%
Immigrants | Belarus
54.6
/100
|
#167
Average
97.3%
Chileans
54.5
/100
|
#168
Average
97.3%
Immigrants | Korea
54.1
/100
|
#169
Average
97.3%
Venezuelans
54.0
/100
|
#170
Average
97.3%
Immigrants | Sri Lanka
53.8
/100
|
#171
Average
97.3%
Arabs
53.4
/100
|
#172
Average
97.3%
Egyptians
52.4
/100
|
#173
Average
97.3%
Immigrants | Kazakhstan
50.0
/100
|
#174
Average
97.3%
Immigrants | Micronesia
48.8
/100
|
#175
Average
97.3%
Immigrants | Taiwan
48.4
/100
|
#176
Average
97.3%
Immigrants | Spain
47.0
/100
|
#177
Average
97.3%
Comanche
42.1
/100
|
#178
Average
97.3%
Immigrants | Kenya
40.3
/100
|
#179
Average
97.3%