Central American vs Slavic 11th Grade
COMPARE
Central American
Slavic
11th Grade
11th Grade Comparison
Central Americans
Slavs
86.9%
11TH GRADE
0.0/ 100
METRIC RATING
335th/ 347
METRIC RANK
94.1%
11TH GRADE
99.9/ 100
METRIC RATING
49th/ 347
METRIC RANK
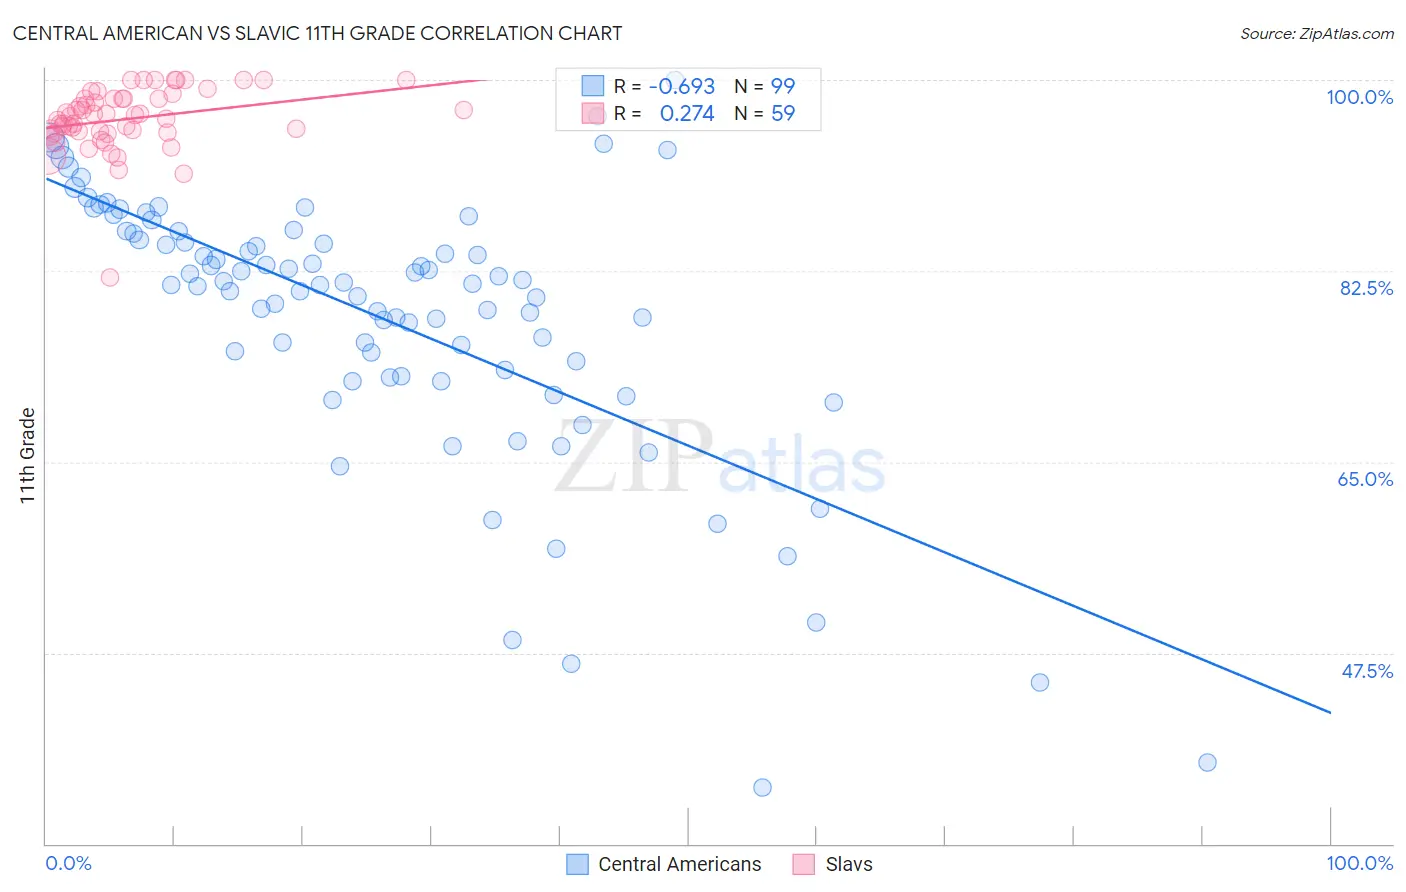
Central American vs Slavic 11th Grade Correlation Chart
The statistical analysis conducted on geographies consisting of 504,619,347 people shows a significant negative correlation between the proportion of Central Americans and percentage of population with at least 11th grade education in the United States with a correlation coefficient (R) of -0.693 and weighted average of 86.9%. Similarly, the statistical analysis conducted on geographies consisting of 270,868,354 people shows a weak positive correlation between the proportion of Slavs and percentage of population with at least 11th grade education in the United States with a correlation coefficient (R) of 0.274 and weighted average of 94.1%, a difference of 8.2%.
11th Grade Correlation Summary
| Measurement | Central American | Slavic |
| Minimum | 35.2% | 81.9% |
| Maximum | 100.0% | 100.0% |
| Range | 64.8% | 18.1% |
| Mean | 78.1% | 96.4% |
| Median | 81.3% | 96.7% |
| Interquartile 25% (IQ1) | 72.9% | 95.2% |
| Interquartile 75% (IQ3) | 85.9% | 98.3% |
| Interquartile Range (IQR) | 13.0% | 3.1% |
| Standard Deviation (Sample) | 12.4% | 2.9% |
| Standard Deviation (Population) | 12.3% | 2.9% |
Similar Demographics by 11th Grade
Demographics Similar to Central Americans by 11th Grade
In terms of 11th grade, the demographic groups most similar to Central Americans are Immigrants from Dominican Republic (86.9%, a difference of 0.040%), Immigrants from Honduras (86.9%, a difference of 0.040%), Houma (87.0%, a difference of 0.10%), Immigrants from Yemen (87.1%, a difference of 0.16%), and Immigrants from Latin America (86.8%, a difference of 0.17%).
| Demographics | Rating | Rank | 11th Grade |
| Tohono O'odham | 0.0 /100 | #328 | Tragic 87.6% |
| Mexican American Indians | 0.0 /100 | #329 | Tragic 87.5% |
| Hondurans | 0.0 /100 | #330 | Tragic 87.4% |
| Hispanics or Latinos | 0.0 /100 | #331 | Tragic 87.3% |
| Immigrants | Azores | 0.0 /100 | #332 | Tragic 87.2% |
| Immigrants | Yemen | 0.0 /100 | #333 | Tragic 87.1% |
| Houma | 0.0 /100 | #334 | Tragic 87.0% |
| Central Americans | 0.0 /100 | #335 | Tragic 86.9% |
| Immigrants | Dominican Republic | 0.0 /100 | #336 | Tragic 86.9% |
| Immigrants | Honduras | 0.0 /100 | #337 | Tragic 86.9% |
| Immigrants | Latin America | 0.0 /100 | #338 | Tragic 86.8% |
| Guatemalans | 0.0 /100 | #339 | Tragic 86.4% |
| Salvadorans | 0.0 /100 | #340 | Tragic 86.2% |
| Mexicans | 0.0 /100 | #341 | Tragic 86.1% |
| Immigrants | Guatemala | 0.0 /100 | #342 | Tragic 85.8% |
Demographics Similar to Slavs by 11th Grade
In terms of 11th grade, the demographic groups most similar to Slavs are Filipino (94.1%, a difference of 0.0%), Macedonian (94.1%, a difference of 0.0%), French (94.1%, a difference of 0.0%), Serbian (94.1%, a difference of 0.010%), and Australian (94.1%, a difference of 0.020%).
| Demographics | Rating | Rank | 11th Grade |
| Immigrants | Austria | 99.9 /100 | #42 | Exceptional 94.1% |
| Greeks | 99.9 /100 | #43 | Exceptional 94.1% |
| Immigrants | Ireland | 99.9 /100 | #44 | Exceptional 94.1% |
| Australians | 99.9 /100 | #45 | Exceptional 94.1% |
| Serbians | 99.9 /100 | #46 | Exceptional 94.1% |
| Filipinos | 99.9 /100 | #47 | Exceptional 94.1% |
| Macedonians | 99.9 /100 | #48 | Exceptional 94.1% |
| Slavs | 99.9 /100 | #49 | Exceptional 94.1% |
| French | 99.9 /100 | #50 | Exceptional 94.1% |
| Turks | 99.9 /100 | #51 | Exceptional 94.0% |
| Immigrants | Canada | 99.9 /100 | #52 | Exceptional 94.0% |
| Immigrants | Australia | 99.9 /100 | #53 | Exceptional 94.0% |
| Immigrants | North America | 99.9 /100 | #54 | Exceptional 94.0% |
| Czechoslovakians | 99.9 /100 | #55 | Exceptional 94.0% |
| French Canadians | 99.9 /100 | #56 | Exceptional 94.0% |