Central American vs Immigrants from Eastern Asia Nursery School
COMPARE
Central American
Immigrants from Eastern Asia
Nursery School
Nursery School Comparison
Central Americans
Immigrants from Eastern Asia
96.6%
NURSERY SCHOOL
0.0/ 100
METRIC RATING
333rd/ 347
METRIC RANK
97.7%
NURSERY SCHOOL
1.6/ 100
METRIC RATING
239th/ 347
METRIC RANK
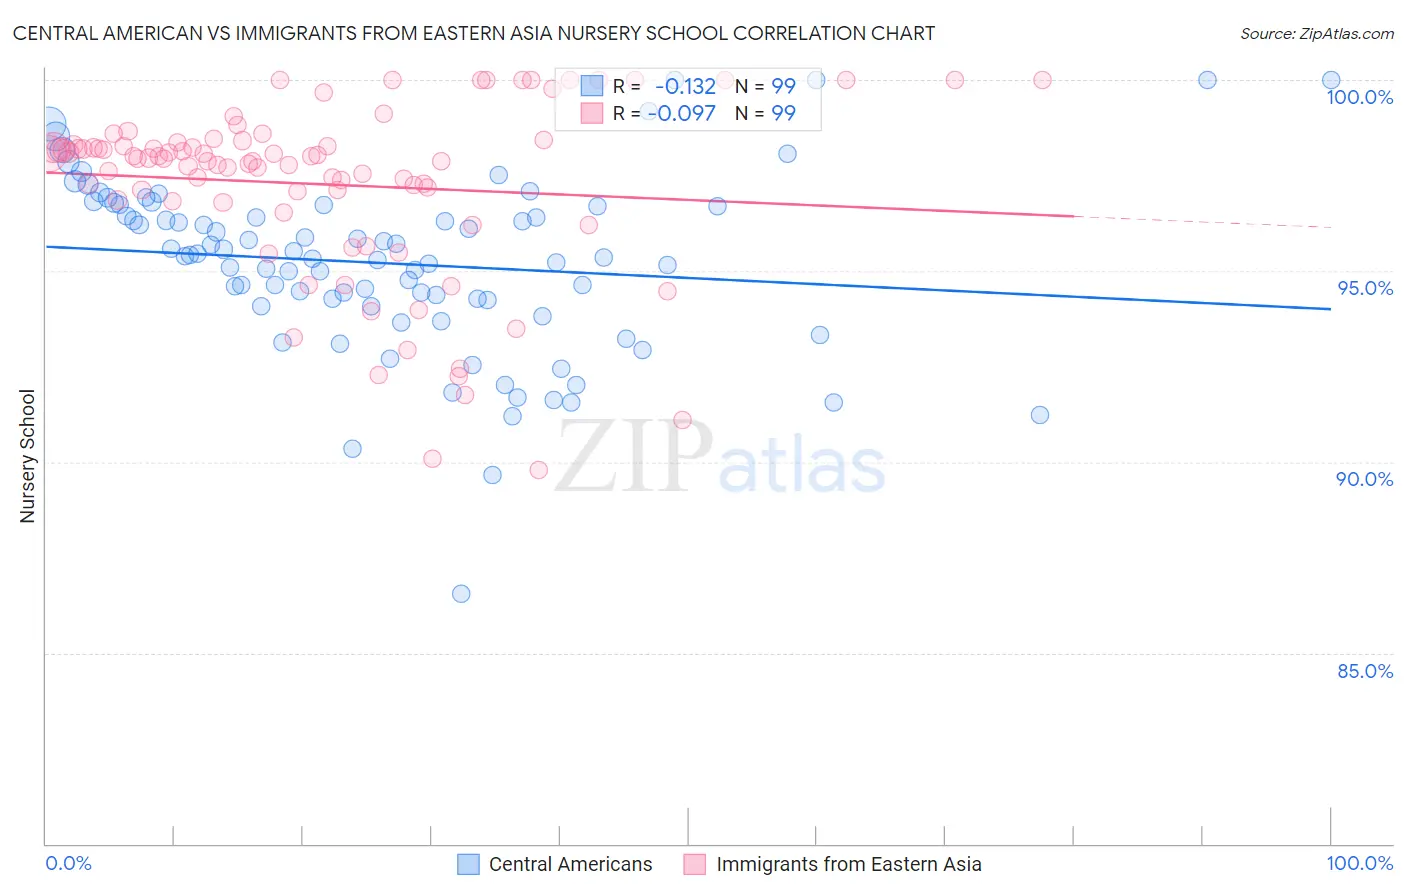
Central American vs Immigrants from Eastern Asia Nursery School Correlation Chart
The statistical analysis conducted on geographies consisting of 504,619,275 people shows a poor negative correlation between the proportion of Central Americans and percentage of population with at least nursery school education in the United States with a correlation coefficient (R) of -0.132 and weighted average of 96.6%. Similarly, the statistical analysis conducted on geographies consisting of 499,865,893 people shows a slight negative correlation between the proportion of Immigrants from Eastern Asia and percentage of population with at least nursery school education in the United States with a correlation coefficient (R) of -0.097 and weighted average of 97.7%, a difference of 1.1%.
Nursery School Correlation Summary
| Measurement | Central American | Immigrants from Eastern Asia |
| Minimum | 86.5% | 89.8% |
| Maximum | 100.0% | 100.0% |
| Range | 13.5% | 10.2% |
| Mean | 95.2% | 97.3% |
| Median | 95.4% | 98.0% |
| Interquartile 25% (IQ1) | 94.1% | 96.8% |
| Interquartile 75% (IQ3) | 96.7% | 98.4% |
| Interquartile Range (IQR) | 2.6% | 1.5% |
| Standard Deviation (Sample) | 2.3% | 2.3% |
| Standard Deviation (Population) | 2.3% | 2.3% |
Similar Demographics by Nursery School
Demographics Similar to Central Americans by Nursery School
In terms of nursery school, the demographic groups most similar to Central Americans are Immigrants from Dominican Republic (96.6%, a difference of 0.010%), Yakama (96.6%, a difference of 0.020%), Immigrants from Armenia (96.7%, a difference of 0.030%), Bangladeshi (96.6%, a difference of 0.040%), and Immigrants from Vietnam (96.7%, a difference of 0.060%).
| Demographics | Rating | Rank | Nursery School |
| Indonesians | 0.0 /100 | #326 | Tragic 96.8% |
| Mexicans | 0.0 /100 | #327 | Tragic 96.8% |
| Immigrants | Latin America | 0.0 /100 | #328 | Tragic 96.7% |
| Immigrants | Vietnam | 0.0 /100 | #329 | Tragic 96.7% |
| Japanese | 0.0 /100 | #330 | Tragic 96.7% |
| Immigrants | Armenia | 0.0 /100 | #331 | Tragic 96.7% |
| Yakama | 0.0 /100 | #332 | Tragic 96.6% |
| Central Americans | 0.0 /100 | #333 | Tragic 96.6% |
| Immigrants | Dominican Republic | 0.0 /100 | #334 | Tragic 96.6% |
| Bangladeshis | 0.0 /100 | #335 | Tragic 96.6% |
| Guatemalans | 0.0 /100 | #336 | Tragic 96.6% |
| Immigrants | Cambodia | 0.0 /100 | #337 | Tragic 96.5% |
| Immigrants | Fiji | 0.0 /100 | #338 | Tragic 96.5% |
| Immigrants | Guatemala | 0.0 /100 | #339 | Tragic 96.4% |
| Immigrants | Central America | 0.0 /100 | #340 | Tragic 96.4% |
Demographics Similar to Immigrants from Eastern Asia by Nursery School
In terms of nursery school, the demographic groups most similar to Immigrants from Eastern Asia are Nigerian (97.7%, a difference of 0.010%), Korean (97.7%, a difference of 0.010%), U.S. Virgin Islander (97.7%, a difference of 0.020%), Colombian (97.7%, a difference of 0.020%), and Immigrants from Pakistan (97.7%, a difference of 0.020%).
| Demographics | Rating | Rank | Nursery School |
| Immigrants | Uruguay | 2.3 /100 | #232 | Tragic 97.7% |
| U.S. Virgin Islanders | 2.1 /100 | #233 | Tragic 97.7% |
| Colombians | 2.1 /100 | #234 | Tragic 97.7% |
| Immigrants | Pakistan | 2.1 /100 | #235 | Tragic 97.7% |
| Immigrants | Malaysia | 1.9 /100 | #236 | Tragic 97.7% |
| Immigrants | Western Asia | 1.9 /100 | #237 | Tragic 97.7% |
| Nigerians | 1.7 /100 | #238 | Tragic 97.7% |
| Immigrants | Eastern Asia | 1.6 /100 | #239 | Tragic 97.7% |
| Koreans | 1.4 /100 | #240 | Tragic 97.7% |
| Immigrants | Indonesia | 1.1 /100 | #241 | Tragic 97.7% |
| Liberians | 1.1 /100 | #242 | Tragic 97.7% |
| Asians | 1.1 /100 | #243 | Tragic 97.6% |
| South Americans | 1.0 /100 | #244 | Tragic 97.6% |
| Bolivians | 1.0 /100 | #245 | Tragic 97.6% |
| Peruvians | 1.0 /100 | #246 | Tragic 97.6% |