Central American Indian vs Immigrants from Guatemala 9th Grade
COMPARE
Central American Indian
Immigrants from Guatemala
9th Grade
9th Grade Comparison
Central American Indians
Immigrants from Guatemala
91.5%
9TH GRADE
0.0/ 100
METRIC RATING
325th/ 347
METRIC RANK
89.4%
9TH GRADE
0.0/ 100
METRIC RATING
343rd/ 347
METRIC RANK
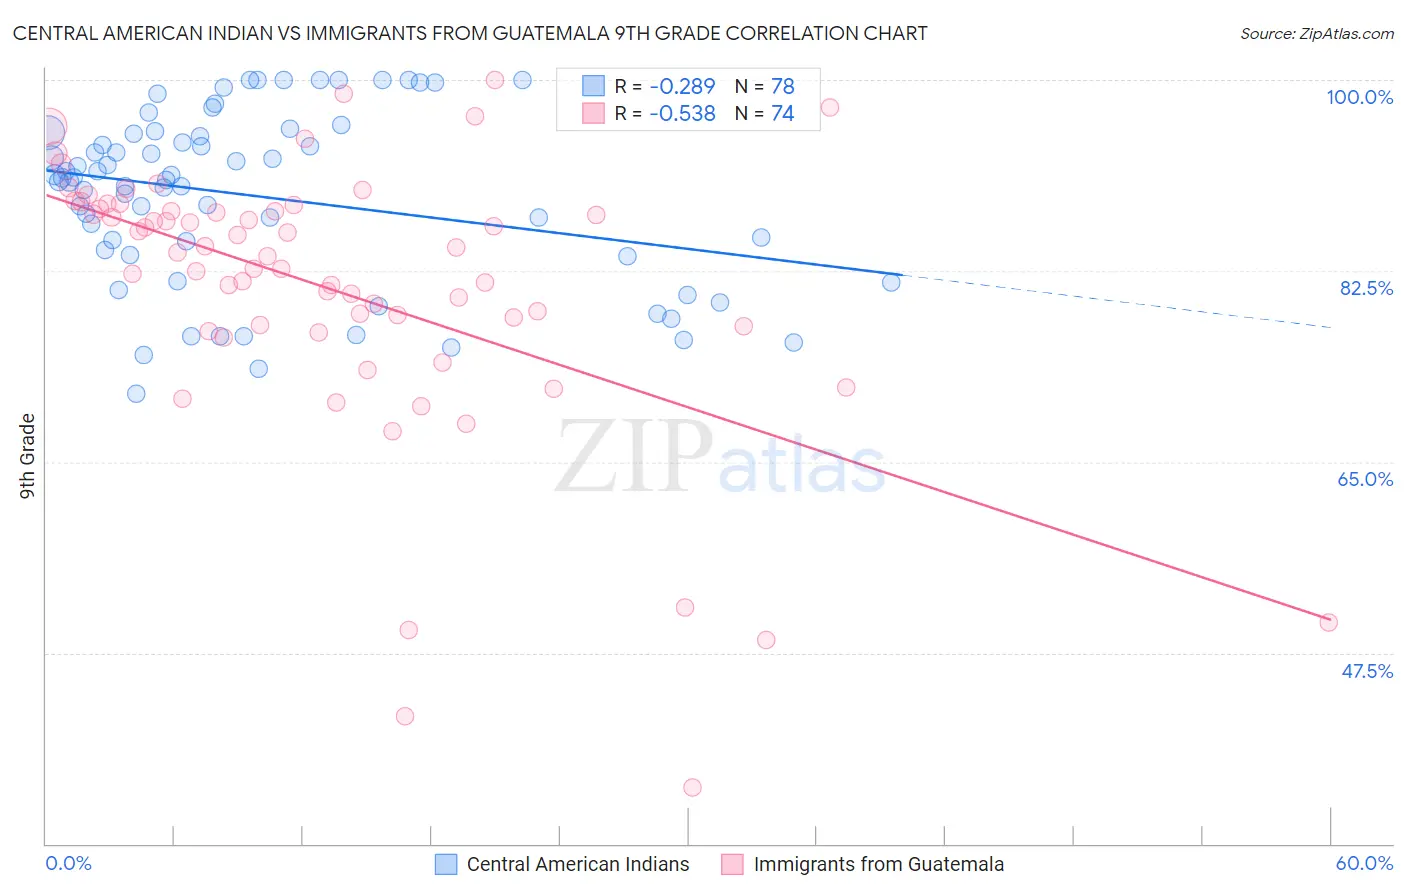
Central American Indian vs Immigrants from Guatemala 9th Grade Correlation Chart
The statistical analysis conducted on geographies consisting of 326,142,359 people shows a weak negative correlation between the proportion of Central American Indians and percentage of population with at least 9th grade education in the United States with a correlation coefficient (R) of -0.289 and weighted average of 91.5%. Similarly, the statistical analysis conducted on geographies consisting of 377,286,142 people shows a substantial negative correlation between the proportion of Immigrants from Guatemala and percentage of population with at least 9th grade education in the United States with a correlation coefficient (R) of -0.538 and weighted average of 89.4%, a difference of 2.3%.
9th Grade Correlation Summary
| Measurement | Central American Indian | Immigrants from Guatemala |
| Minimum | 71.2% | 35.2% |
| Maximum | 100.0% | 100.0% |
| Range | 28.8% | 64.8% |
| Mean | 89.3% | 80.9% |
| Median | 90.9% | 84.1% |
| Interquartile 25% (IQ1) | 84.0% | 77.5% |
| Interquartile 75% (IQ3) | 95.1% | 88.2% |
| Interquartile Range (IQR) | 11.1% | 10.7% |
| Standard Deviation (Sample) | 7.9% | 12.7% |
| Standard Deviation (Population) | 7.8% | 12.6% |
Demographics Similar to Central American Indians and Immigrants from Guatemala by 9th Grade
In terms of 9th grade, the demographic groups most similar to Central American Indians are Immigrants from Armenia (91.4%, a difference of 0.10%), Immigrants from Nicaragua (91.3%, a difference of 0.15%), Immigrants from Belize (91.8%, a difference of 0.33%), Dominican (91.1%, a difference of 0.44%), and Honduran (91.0%, a difference of 0.47%). Similarly, the demographic groups most similar to Immigrants from Guatemala are Salvadoran (89.6%, a difference of 0.20%), Guatemalan (89.9%, a difference of 0.51%), Immigrants from El Salvador (89.0%, a difference of 0.51%), Mexican (90.0%, a difference of 0.63%), and Yakama (90.1%, a difference of 0.69%).
| Demographics | Rating | Rank | 9th Grade |
| Immigrants | Belize | 0.0 /100 | #324 | Tragic 91.8% |
| Central American Indians | 0.0 /100 | #325 | Tragic 91.5% |
| Immigrants | Armenia | 0.0 /100 | #326 | Tragic 91.4% |
| Immigrants | Nicaragua | 0.0 /100 | #327 | Tragic 91.3% |
| Dominicans | 0.0 /100 | #328 | Tragic 91.1% |
| Hondurans | 0.0 /100 | #329 | Tragic 91.0% |
| Immigrants | Cabo Verde | 0.0 /100 | #330 | Tragic 90.9% |
| Mexican American Indians | 0.0 /100 | #331 | Tragic 90.9% |
| Hispanics or Latinos | 0.0 /100 | #332 | Tragic 90.9% |
| Immigrants | Yemen | 0.0 /100 | #333 | Tragic 90.8% |
| Immigrants | Azores | 0.0 /100 | #334 | Tragic 90.8% |
| Immigrants | Honduras | 0.0 /100 | #335 | Tragic 90.6% |
| Immigrants | Dominican Republic | 0.0 /100 | #336 | Tragic 90.5% |
| Immigrants | Latin America | 0.0 /100 | #337 | Tragic 90.4% |
| Central Americans | 0.0 /100 | #338 | Tragic 90.4% |
| Yakama | 0.0 /100 | #339 | Tragic 90.1% |
| Mexicans | 0.0 /100 | #340 | Tragic 90.0% |
| Guatemalans | 0.0 /100 | #341 | Tragic 89.9% |
| Salvadorans | 0.0 /100 | #342 | Tragic 89.6% |
| Immigrants | Guatemala | 0.0 /100 | #343 | Tragic 89.4% |
| Immigrants | El Salvador | 0.0 /100 | #344 | Tragic 89.0% |