Central American Indian vs Immigrants from Chile 5th Grade
COMPARE
Central American Indian
Immigrants from Chile
5th Grade
5th Grade Comparison
Central American Indians
Immigrants from Chile
95.7%
5TH GRADE
0.0/ 100
METRIC RATING
320th/ 347
METRIC RANK
97.2%
5TH GRADE
16.6/ 100
METRIC RATING
201st/ 347
METRIC RANK
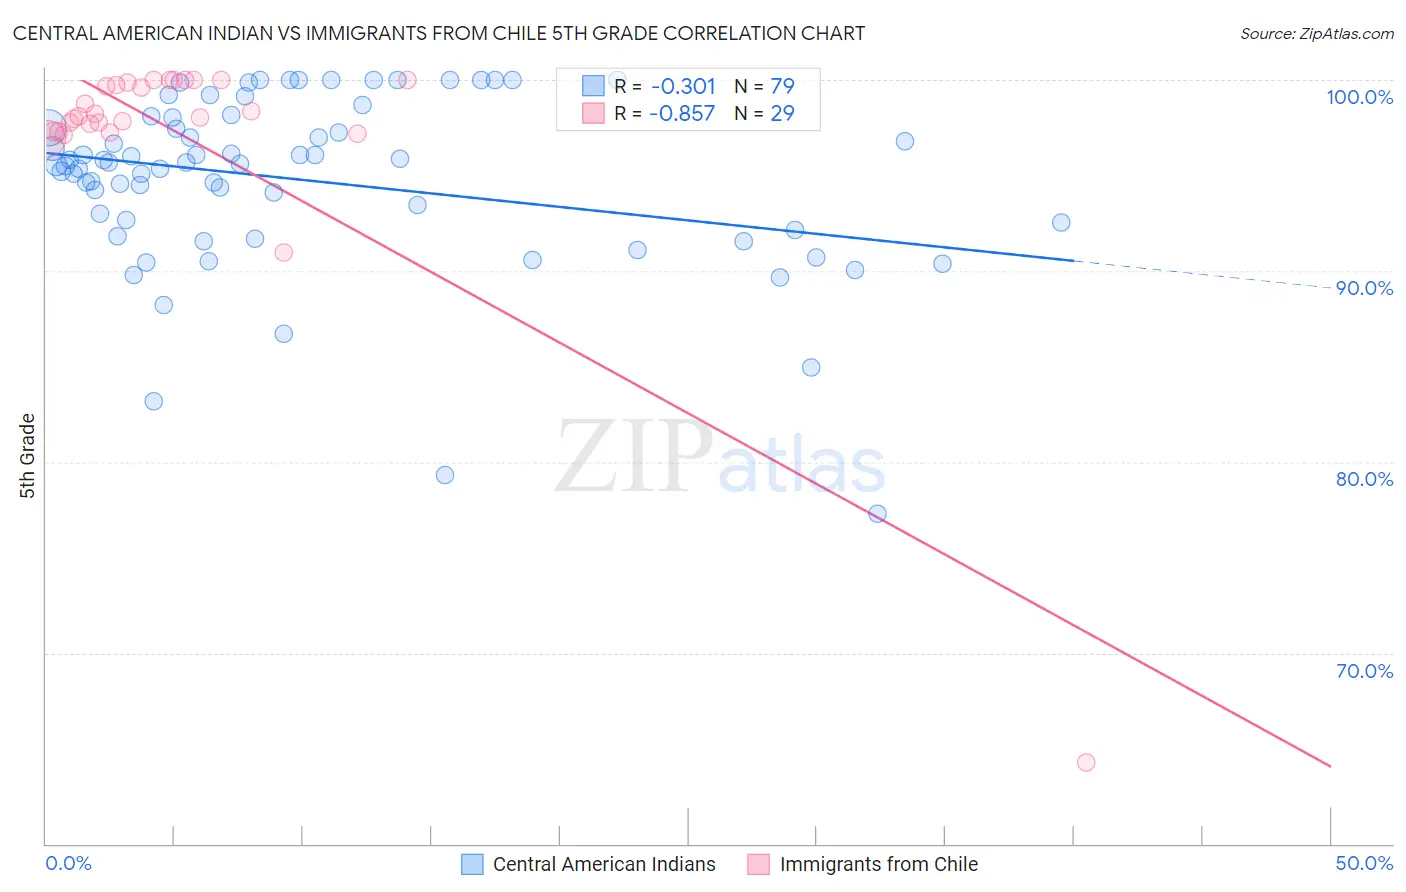
Central American Indian vs Immigrants from Chile 5th Grade Correlation Chart
The statistical analysis conducted on geographies consisting of 326,142,721 people shows a mild negative correlation between the proportion of Central American Indians and percentage of population with at least 5th grade education in the United States with a correlation coefficient (R) of -0.301 and weighted average of 95.7%. Similarly, the statistical analysis conducted on geographies consisting of 218,647,266 people shows a very strong negative correlation between the proportion of Immigrants from Chile and percentage of population with at least 5th grade education in the United States with a correlation coefficient (R) of -0.857 and weighted average of 97.2%, a difference of 1.5%.
5th Grade Correlation Summary
| Measurement | Central American Indian | Immigrants from Chile |
| Minimum | 77.3% | 64.3% |
| Maximum | 100.0% | 100.0% |
| Range | 22.7% | 35.7% |
| Mean | 94.7% | 97.2% |
| Median | 95.6% | 98.1% |
| Interquartile 25% (IQ1) | 92.2% | 97.3% |
| Interquartile 75% (IQ3) | 98.1% | 99.9% |
| Interquartile Range (IQR) | 5.9% | 2.6% |
| Standard Deviation (Sample) | 4.6% | 6.6% |
| Standard Deviation (Population) | 4.6% | 6.5% |
Similar Demographics by 5th Grade
Demographics Similar to Central American Indians by 5th Grade
In terms of 5th grade, the demographic groups most similar to Central American Indians are Japanese (95.7%, a difference of 0.0%), Immigrants from Vietnam (95.8%, a difference of 0.050%), Belizean (95.8%, a difference of 0.070%), Immigrants from Belize (95.7%, a difference of 0.080%), and Immigrants from Nicaragua (95.6%, a difference of 0.090%).
| Demographics | Rating | Rank | 5th Grade |
| Bangladeshis | 0.0 /100 | #313 | Tragic 95.9% |
| Immigrants | Portugal | 0.0 /100 | #314 | Tragic 95.9% |
| Nicaraguans | 0.0 /100 | #315 | Tragic 95.9% |
| Immigrants | Ecuador | 0.0 /100 | #316 | Tragic 95.8% |
| Belizeans | 0.0 /100 | #317 | Tragic 95.8% |
| Immigrants | Vietnam | 0.0 /100 | #318 | Tragic 95.8% |
| Japanese | 0.0 /100 | #319 | Tragic 95.7% |
| Central American Indians | 0.0 /100 | #320 | Tragic 95.7% |
| Immigrants | Belize | 0.0 /100 | #321 | Tragic 95.7% |
| Immigrants | Nicaragua | 0.0 /100 | #322 | Tragic 95.6% |
| Immigrants | Fiji | 0.0 /100 | #323 | Tragic 95.6% |
| Hondurans | 0.0 /100 | #324 | Tragic 95.6% |
| Hispanics or Latinos | 0.0 /100 | #325 | Tragic 95.6% |
| Immigrants | Cambodia | 0.0 /100 | #326 | Tragic 95.5% |
| Dominicans | 0.0 /100 | #327 | Tragic 95.5% |
Demographics Similar to Immigrants from Chile by 5th Grade
In terms of 5th grade, the demographic groups most similar to Immigrants from Chile are Immigrants from Northern Africa (97.2%, a difference of 0.0%), Native/Alaskan (97.2%, a difference of 0.010%), African (97.2%, a difference of 0.010%), Immigrants from Bahamas (97.2%, a difference of 0.010%), and Immigrants from Zaire (97.1%, a difference of 0.020%).
| Demographics | Rating | Rank | 5th Grade |
| Immigrants | Albania | 28.5 /100 | #194 | Fair 97.2% |
| Guamanians/Chamorros | 26.8 /100 | #195 | Fair 97.2% |
| Hawaiians | 25.6 /100 | #196 | Fair 97.2% |
| Brazilians | 25.4 /100 | #197 | Fair 97.2% |
| Immigrants | Uganda | 21.1 /100 | #198 | Fair 97.2% |
| Natives/Alaskans | 18.0 /100 | #199 | Poor 97.2% |
| Immigrants | Northern Africa | 16.8 /100 | #200 | Poor 97.2% |
| Immigrants | Chile | 16.6 /100 | #201 | Poor 97.2% |
| Africans | 15.3 /100 | #202 | Poor 97.2% |
| Immigrants | Bahamas | 14.9 /100 | #203 | Poor 97.2% |
| Immigrants | Zaire | 13.7 /100 | #204 | Poor 97.1% |
| Moroccans | 12.0 /100 | #205 | Poor 97.1% |
| Paiute | 11.6 /100 | #206 | Poor 97.1% |
| Iraqis | 10.9 /100 | #207 | Poor 97.1% |
| Laotians | 10.8 /100 | #208 | Poor 97.1% |