Celtic vs Brazilian 6th Grade
COMPARE
Celtic
Brazilian
6th Grade
6th Grade Comparison
Celtics
Brazilians
97.8%
6TH GRADE
99.9/ 100
METRIC RATING
48th/ 347
METRIC RANK
96.9%
6TH GRADE
20.1/ 100
METRIC RATING
197th/ 347
METRIC RANK
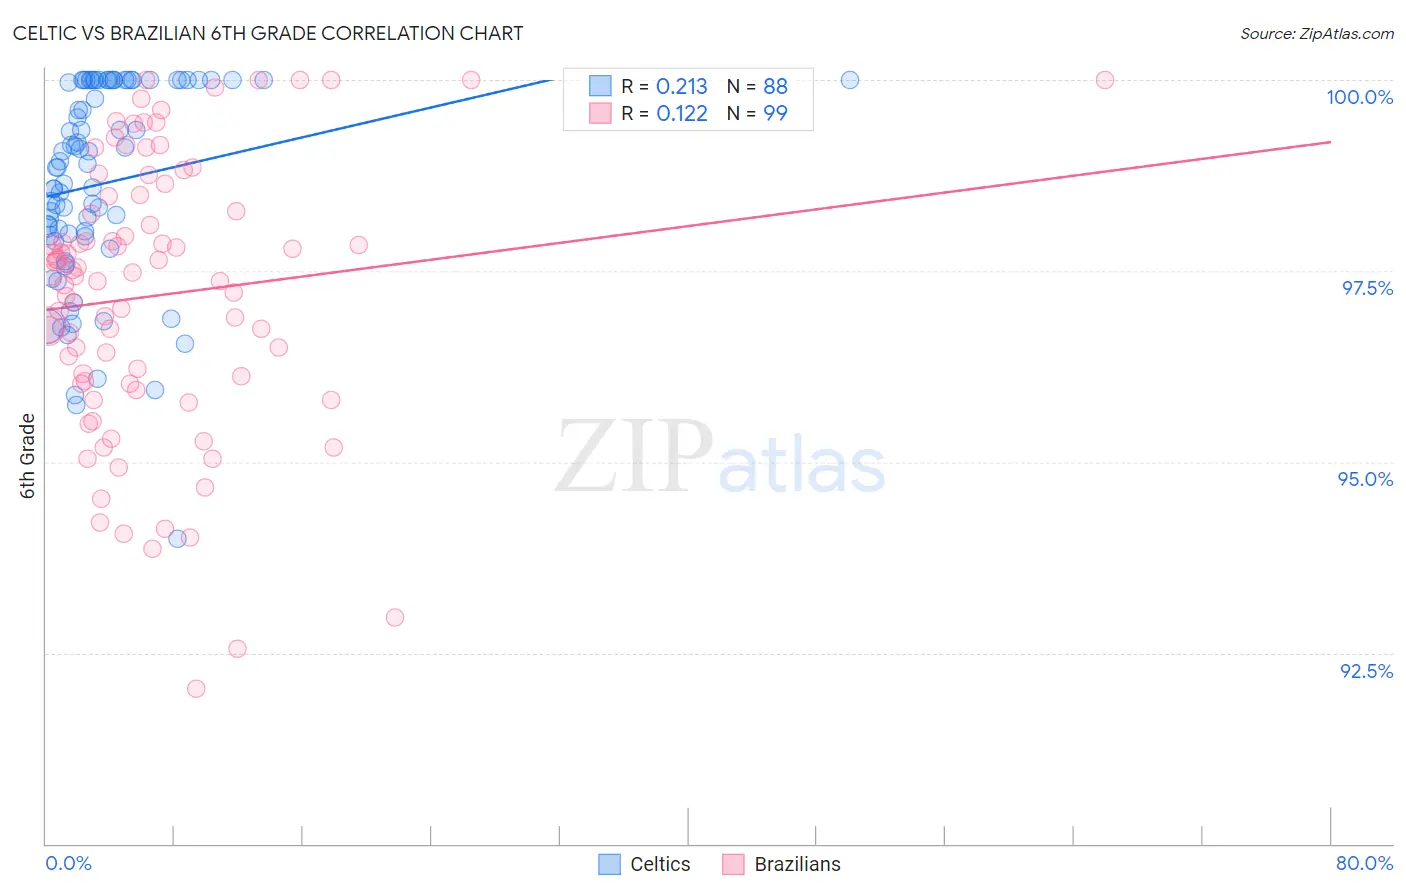
Celtic vs Brazilian 6th Grade Correlation Chart
The statistical analysis conducted on geographies consisting of 168,875,705 people shows a weak positive correlation between the proportion of Celtics and percentage of population with at least 6th grade education in the United States with a correlation coefficient (R) of 0.213 and weighted average of 97.8%. Similarly, the statistical analysis conducted on geographies consisting of 323,962,626 people shows a poor positive correlation between the proportion of Brazilians and percentage of population with at least 6th grade education in the United States with a correlation coefficient (R) of 0.122 and weighted average of 96.9%, a difference of 0.90%.
6th Grade Correlation Summary
| Measurement | Celtic | Brazilian |
| Minimum | 94.0% | 92.0% |
| Maximum | 100.0% | 100.0% |
| Range | 6.0% | 8.0% |
| Mean | 98.6% | 97.2% |
| Median | 98.9% | 97.5% |
| Interquartile 25% (IQ1) | 98.0% | 96.0% |
| Interquartile 75% (IQ3) | 100.0% | 98.5% |
| Interquartile Range (IQR) | 2.0% | 2.5% |
| Standard Deviation (Sample) | 1.3% | 1.8% |
| Standard Deviation (Population) | 1.3% | 1.8% |
Similar Demographics by 6th Grade
Demographics Similar to Celtics by 6th Grade
In terms of 6th grade, the demographic groups most similar to Celtics are Native Hawaiian (97.8%, a difference of 0.0%), Estonian (97.8%, a difference of 0.0%), Immigrants from Scotland (97.8%, a difference of 0.0%), Arapaho (97.8%, a difference of 0.010%), and Maltese (97.8%, a difference of 0.010%).
| Demographics | Rating | Rank | 6th Grade |
| Eastern Europeans | 99.9 /100 | #41 | Exceptional 97.9% |
| Hungarians | 99.9 /100 | #42 | Exceptional 97.8% |
| Northern Europeans | 99.9 /100 | #43 | Exceptional 97.8% |
| Czechoslovakians | 99.9 /100 | #44 | Exceptional 97.8% |
| Bulgarians | 99.9 /100 | #45 | Exceptional 97.8% |
| Arapaho | 99.9 /100 | #46 | Exceptional 97.8% |
| Native Hawaiians | 99.9 /100 | #47 | Exceptional 97.8% |
| Celtics | 99.9 /100 | #48 | Exceptional 97.8% |
| Estonians | 99.8 /100 | #49 | Exceptional 97.8% |
| Immigrants | Scotland | 99.8 /100 | #50 | Exceptional 97.8% |
| Maltese | 99.8 /100 | #51 | Exceptional 97.8% |
| Australians | 99.8 /100 | #52 | Exceptional 97.8% |
| Slavs | 99.8 /100 | #53 | Exceptional 97.8% |
| Creek | 99.8 /100 | #54 | Exceptional 97.7% |
| Aleuts | 99.8 /100 | #55 | Exceptional 97.7% |
Demographics Similar to Brazilians by 6th Grade
In terms of 6th grade, the demographic groups most similar to Brazilians are Immigrants from Uganda (96.9%, a difference of 0.010%), Immigrants from Albania (96.9%, a difference of 0.010%), Immigrants from Northern Africa (96.9%, a difference of 0.030%), Hawaiian (96.9%, a difference of 0.040%), and Paraguayan (96.9%, a difference of 0.040%).
| Demographics | Rating | Rank | 6th Grade |
| Dutch West Indians | 28.3 /100 | #190 | Fair 96.9% |
| Panamanians | 27.3 /100 | #191 | Fair 96.9% |
| Hawaiians | 27.0 /100 | #192 | Fair 96.9% |
| Paraguayans | 26.6 /100 | #193 | Fair 96.9% |
| Immigrants | Lebanon | 25.6 /100 | #194 | Fair 96.9% |
| Immigrants | Brazil | 25.5 /100 | #195 | Fair 96.9% |
| Immigrants | Uganda | 21.2 /100 | #196 | Fair 96.9% |
| Brazilians | 20.1 /100 | #197 | Fair 96.9% |
| Immigrants | Albania | 18.8 /100 | #198 | Poor 96.9% |
| Immigrants | Northern Africa | 15.7 /100 | #199 | Poor 96.9% |
| Africans | 14.8 /100 | #200 | Poor 96.9% |
| Immigrants | Zaire | 14.5 /100 | #201 | Poor 96.9% |
| Immigrants | Chile | 14.2 /100 | #202 | Poor 96.8% |
| Sudanese | 13.9 /100 | #203 | Poor 96.8% |
| Immigrants | Bahamas | 13.8 /100 | #204 | Poor 96.8% |