Cape Verdean vs Uruguayan 7th Grade
COMPARE
Cape Verdean
Uruguayan
7th Grade
7th Grade Comparison
Cape Verdeans
Uruguayans
94.1%
7TH GRADE
0.0/ 100
METRIC RATING
308th/ 347
METRIC RANK
95.4%
7TH GRADE
1.6/ 100
METRIC RATING
244th/ 347
METRIC RANK
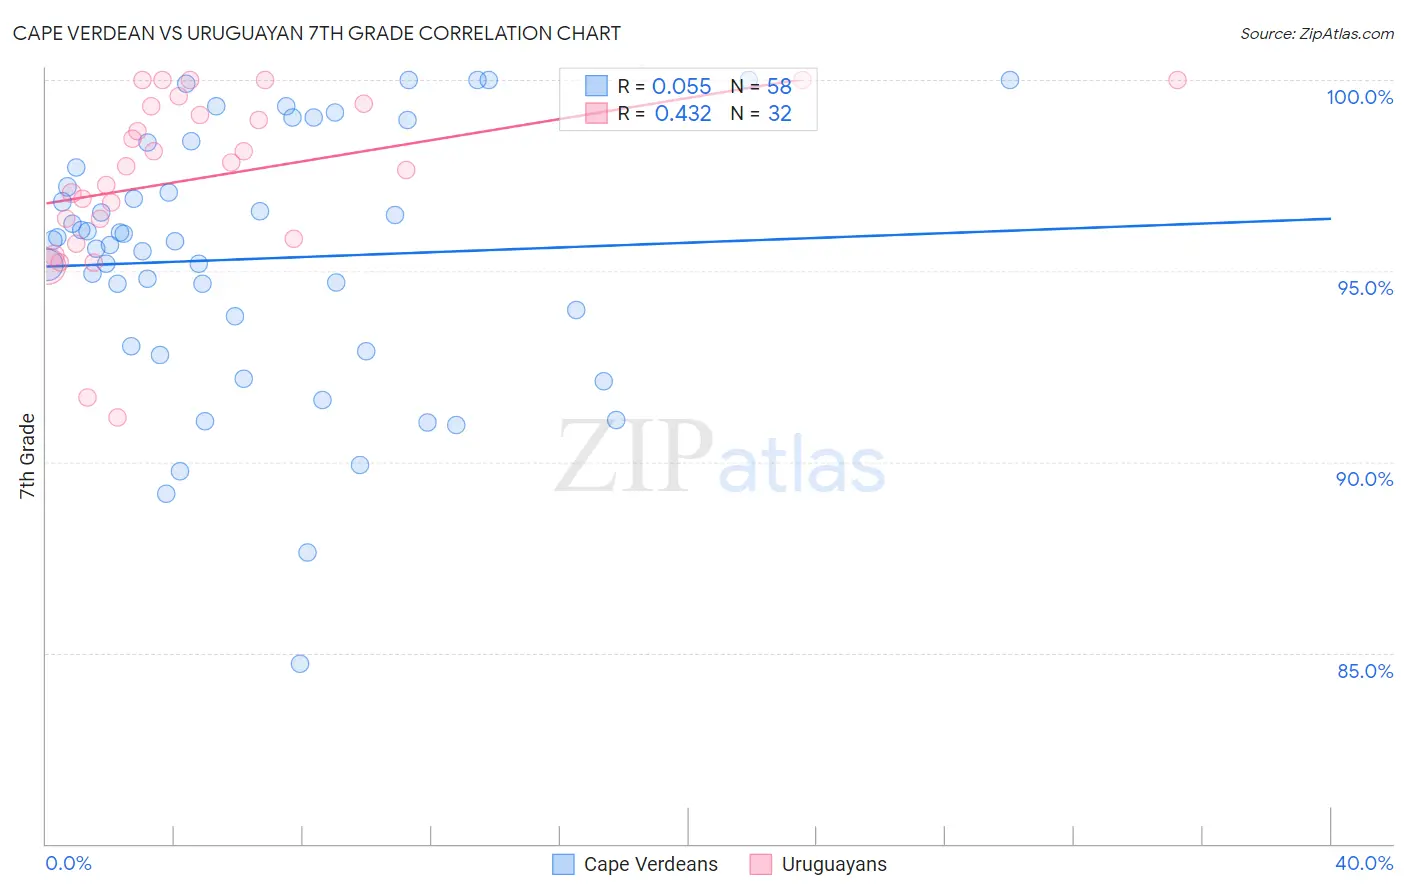
Cape Verdean vs Uruguayan 7th Grade Correlation Chart
The statistical analysis conducted on geographies consisting of 107,537,955 people shows a slight positive correlation between the proportion of Cape Verdeans and percentage of population with at least 7th grade education in the United States with a correlation coefficient (R) of 0.055 and weighted average of 94.1%. Similarly, the statistical analysis conducted on geographies consisting of 144,782,794 people shows a moderate positive correlation between the proportion of Uruguayans and percentage of population with at least 7th grade education in the United States with a correlation coefficient (R) of 0.432 and weighted average of 95.4%, a difference of 1.4%.
7th Grade Correlation Summary
| Measurement | Cape Verdean | Uruguayan |
| Minimum | 84.7% | 91.2% |
| Maximum | 100.0% | 100.0% |
| Range | 15.3% | 8.8% |
| Mean | 95.3% | 97.5% |
| Median | 95.8% | 97.8% |
| Interquartile 25% (IQ1) | 93.0% | 96.1% |
| Interquartile 75% (IQ3) | 97.7% | 99.3% |
| Interquartile Range (IQR) | 4.7% | 3.3% |
| Standard Deviation (Sample) | 3.4% | 2.3% |
| Standard Deviation (Population) | 3.4% | 2.2% |
Similar Demographics by 7th Grade
Demographics Similar to Cape Verdeans by 7th Grade
In terms of 7th grade, the demographic groups most similar to Cape Verdeans are Ecuadorian (94.0%, a difference of 0.060%), Immigrants from Caribbean (94.0%, a difference of 0.070%), Immigrants from Portugal (94.2%, a difference of 0.080%), Puerto Rican (94.0%, a difference of 0.080%), and Immigrants from Guyana (94.2%, a difference of 0.10%).
| Demographics | Rating | Rank | 7th Grade |
| Immigrants | Dominica | 0.0 /100 | #301 | Tragic 94.5% |
| Immigrants | Laos | 0.0 /100 | #302 | Tragic 94.5% |
| Sri Lankans | 0.0 /100 | #303 | Tragic 94.4% |
| Immigrants | Haiti | 0.0 /100 | #304 | Tragic 94.3% |
| Guyanese | 0.0 /100 | #305 | Tragic 94.3% |
| Immigrants | Guyana | 0.0 /100 | #306 | Tragic 94.2% |
| Immigrants | Portugal | 0.0 /100 | #307 | Tragic 94.2% |
| Cape Verdeans | 0.0 /100 | #308 | Tragic 94.1% |
| Ecuadorians | 0.0 /100 | #309 | Tragic 94.0% |
| Immigrants | Caribbean | 0.0 /100 | #310 | Tragic 94.0% |
| Puerto Ricans | 0.0 /100 | #311 | Tragic 94.0% |
| Immigrants | Immigrants | 0.0 /100 | #312 | Tragic 94.0% |
| Immigrants | Bangladesh | 0.0 /100 | #313 | Tragic 94.0% |
| Japanese | 0.0 /100 | #314 | Tragic 94.0% |
| Vietnamese | 0.0 /100 | #315 | Tragic 93.9% |
Demographics Similar to Uruguayans by 7th Grade
In terms of 7th grade, the demographic groups most similar to Uruguayans are U.S. Virgin Islander (95.4%, a difference of 0.0%), Immigrants from Middle Africa (95.4%, a difference of 0.010%), Ethiopian (95.4%, a difference of 0.010%), Immigrants from Sierra Leone (95.5%, a difference of 0.030%), and South American Indian (95.5%, a difference of 0.030%).
| Demographics | Rating | Rank | 7th Grade |
| Immigrants | Asia | 2.3 /100 | #237 | Tragic 95.5% |
| Indians (Asian) | 2.3 /100 | #238 | Tragic 95.5% |
| Jamaicans | 2.2 /100 | #239 | Tragic 95.5% |
| Immigrants | Sierra Leone | 2.0 /100 | #240 | Tragic 95.5% |
| South American Indians | 2.0 /100 | #241 | Tragic 95.5% |
| Immigrants | Senegal | 1.9 /100 | #242 | Tragic 95.5% |
| U.S. Virgin Islanders | 1.6 /100 | #243 | Tragic 95.4% |
| Uruguayans | 1.6 /100 | #244 | Tragic 95.4% |
| Immigrants | Middle Africa | 1.5 /100 | #245 | Tragic 95.4% |
| Ethiopians | 1.5 /100 | #246 | Tragic 95.4% |
| Tongans | 1.3 /100 | #247 | Tragic 95.4% |
| Paiute | 1.2 /100 | #248 | Tragic 95.4% |
| Bolivians | 1.1 /100 | #249 | Tragic 95.4% |
| Immigrants | Cameroon | 0.9 /100 | #250 | Tragic 95.4% |
| Immigrants | Jamaica | 0.9 /100 | #251 | Tragic 95.4% |