Cape Verdean vs Aleut Doctorate Degree
COMPARE
Cape Verdean
Aleut
Doctorate Degree
Doctorate Degree Comparison
Cape Verdeans
Aleuts
1.4%
DOCTORATE DEGREE
0.3/ 100
METRIC RATING
289th/ 347
METRIC RANK
1.5%
DOCTORATE DEGREE
0.4/ 100
METRIC RATING
275th/ 347
METRIC RANK
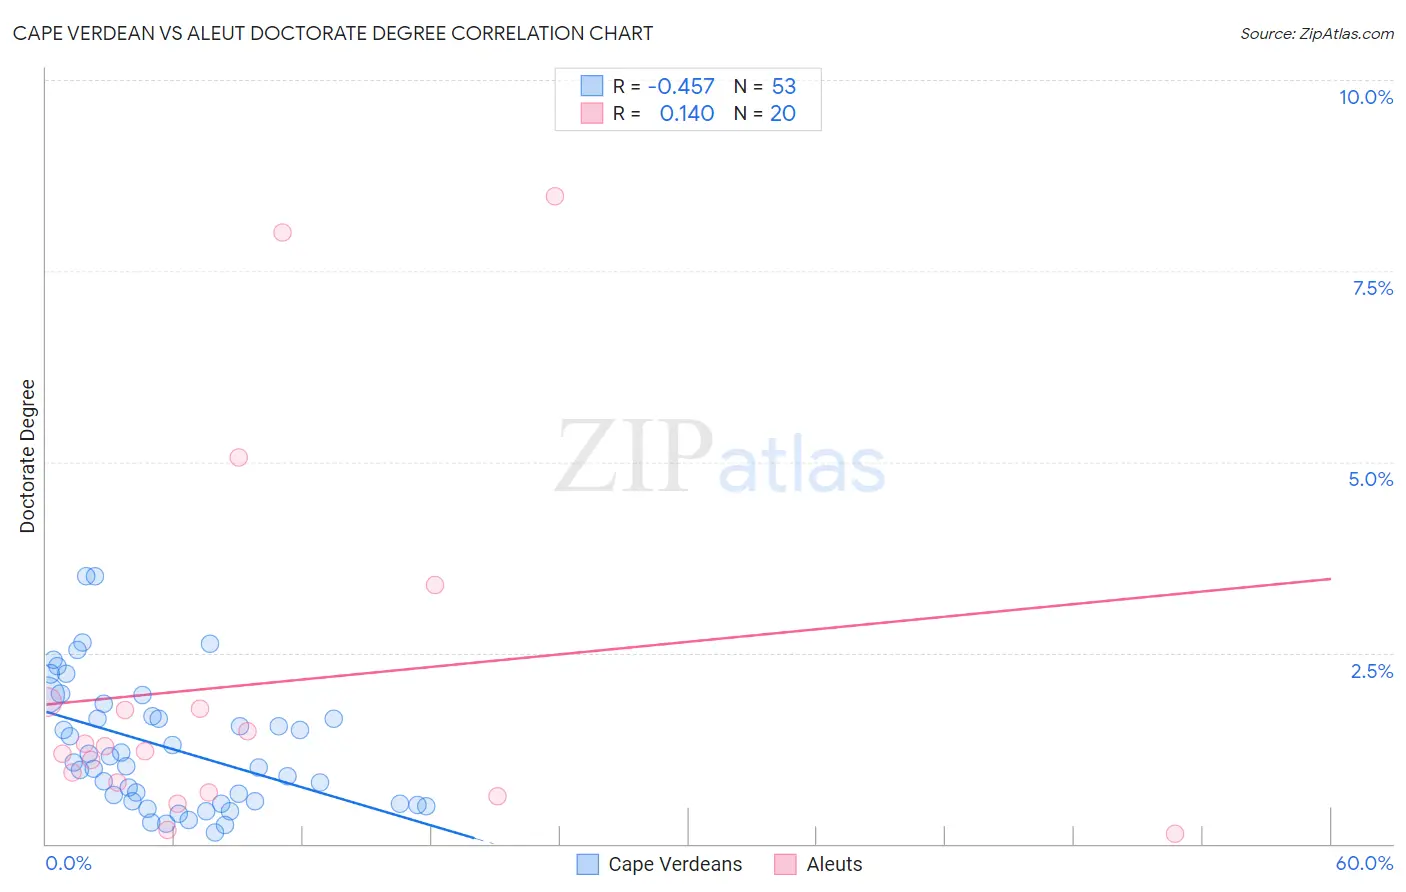
Cape Verdean vs Aleut Doctorate Degree Correlation Chart
The statistical analysis conducted on geographies consisting of 107,405,258 people shows a moderate negative correlation between the proportion of Cape Verdeans and percentage of population with at least doctorate degree education in the United States with a correlation coefficient (R) of -0.457 and weighted average of 1.4%. Similarly, the statistical analysis conducted on geographies consisting of 61,540,256 people shows a poor positive correlation between the proportion of Aleuts and percentage of population with at least doctorate degree education in the United States with a correlation coefficient (R) of 0.140 and weighted average of 1.5%, a difference of 1.7%.
Doctorate Degree Correlation Summary
| Measurement | Cape Verdean | Aleut |
| Minimum | 0.14% | 0.13% |
| Maximum | 3.5% | 8.5% |
| Range | 3.4% | 8.3% |
| Mean | 1.3% | 2.1% |
| Median | 1.1% | 1.2% |
| Interquartile 25% (IQ1) | 0.54% | 0.74% |
| Interquartile 75% (IQ3) | 1.7% | 1.8% |
| Interquartile Range (IQR) | 1.2% | 1.1% |
| Standard Deviation (Sample) | 0.83% | 2.4% |
| Standard Deviation (Population) | 0.82% | 2.3% |
Demographics Similar to Cape Verdeans and Aleuts by Doctorate Degree
In terms of doctorate degree, the demographic groups most similar to Cape Verdeans are Choctaw (1.4%, a difference of 0.020%), Immigrants from El Salvador (1.4%, a difference of 0.14%), Black/African American (1.4%, a difference of 0.24%), Cajun (1.5%, a difference of 0.31%), and Alaska Native (1.4%, a difference of 0.42%). Similarly, the demographic groups most similar to Aleuts are Paiute (1.5%, a difference of 0.050%), Yaqui (1.5%, a difference of 0.12%), Sioux (1.5%, a difference of 0.14%), Immigrants from Barbados (1.5%, a difference of 0.25%), and Bahamian (1.5%, a difference of 0.53%).
| Demographics | Rating | Rank | Doctorate Degree |
| Immigrants | Barbados | 0.4 /100 | #272 | Tragic 1.5% |
| Sioux | 0.4 /100 | #273 | Tragic 1.5% |
| Yaqui | 0.4 /100 | #274 | Tragic 1.5% |
| Aleuts | 0.4 /100 | #275 | Tragic 1.5% |
| Paiute | 0.4 /100 | #276 | Tragic 1.5% |
| Bahamians | 0.4 /100 | #277 | Tragic 1.5% |
| Hawaiians | 0.4 /100 | #278 | Tragic 1.5% |
| Marshallese | 0.4 /100 | #279 | Tragic 1.5% |
| Ecuadorians | 0.4 /100 | #280 | Tragic 1.5% |
| Tohono O'odham | 0.4 /100 | #281 | Tragic 1.5% |
| British West Indians | 0.3 /100 | #282 | Tragic 1.5% |
| Central Americans | 0.3 /100 | #283 | Tragic 1.5% |
| Jamaicans | 0.3 /100 | #284 | Tragic 1.5% |
| Malaysians | 0.3 /100 | #285 | Tragic 1.5% |
| Cherokee | 0.3 /100 | #286 | Tragic 1.5% |
| Cajuns | 0.3 /100 | #287 | Tragic 1.5% |
| Immigrants | El Salvador | 0.3 /100 | #288 | Tragic 1.4% |
| Cape Verdeans | 0.3 /100 | #289 | Tragic 1.4% |
| Choctaw | 0.3 /100 | #290 | Tragic 1.4% |
| Blacks/African Americans | 0.3 /100 | #291 | Tragic 1.4% |
| Alaska Natives | 0.3 /100 | #292 | Tragic 1.4% |