Cajun vs Peruvian Doctorate Degree
COMPARE
Cajun
Peruvian
Doctorate Degree
Doctorate Degree Comparison
Cajuns
Peruvians
1.5%
DOCTORATE DEGREE
0.3/ 100
METRIC RATING
287th/ 347
METRIC RANK
1.8%
DOCTORATE DEGREE
34.4/ 100
METRIC RATING
186th/ 347
METRIC RANK
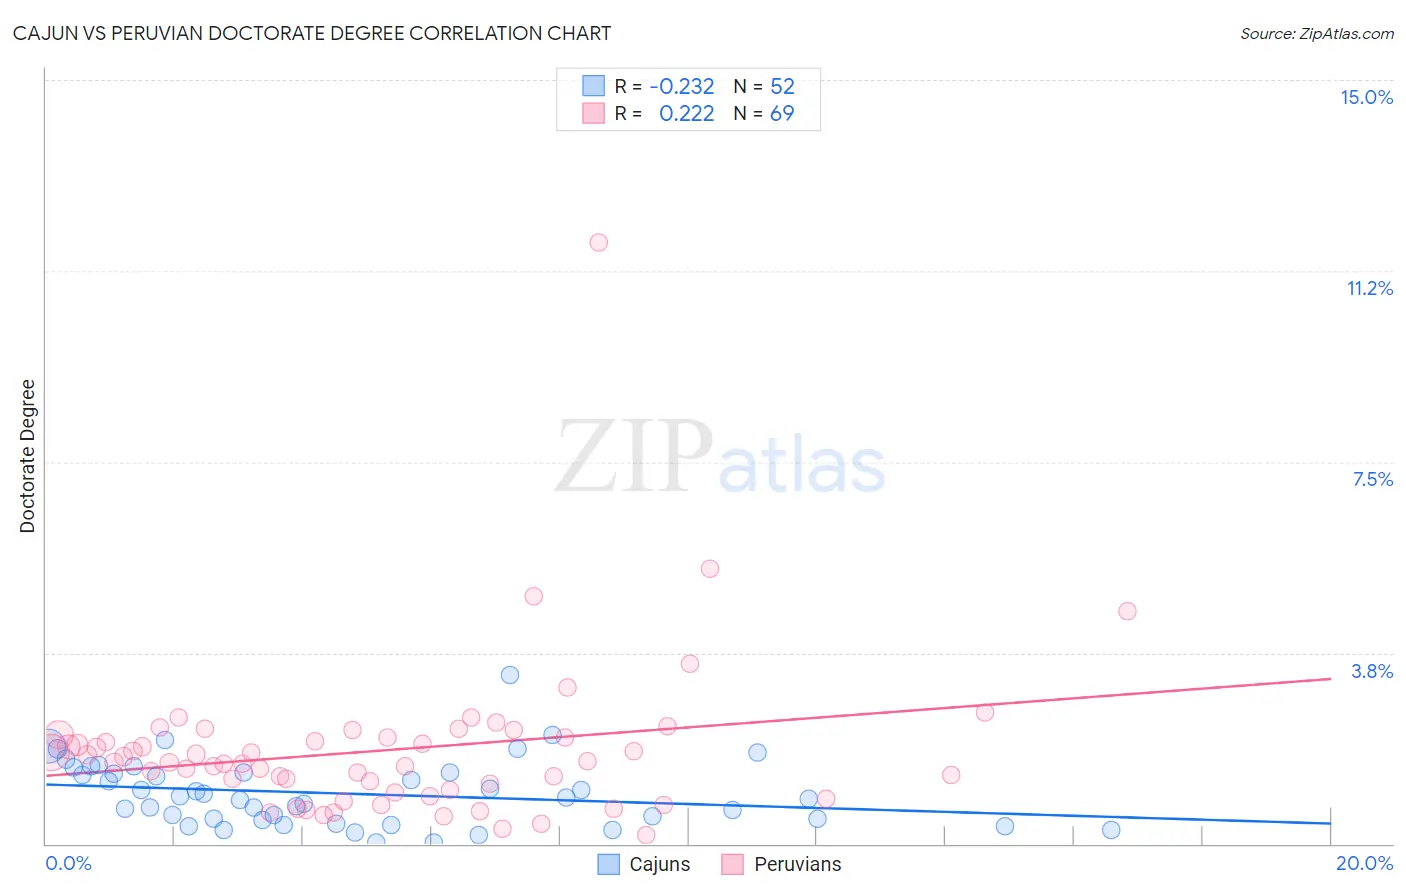
Cajun vs Peruvian Doctorate Degree Correlation Chart
The statistical analysis conducted on geographies consisting of 148,318,310 people shows a weak negative correlation between the proportion of Cajuns and percentage of population with at least doctorate degree education in the United States with a correlation coefficient (R) of -0.232 and weighted average of 1.5%. Similarly, the statistical analysis conducted on geographies consisting of 360,973,497 people shows a weak positive correlation between the proportion of Peruvians and percentage of population with at least doctorate degree education in the United States with a correlation coefficient (R) of 0.222 and weighted average of 1.8%, a difference of 23.8%.
Doctorate Degree Correlation Summary
| Measurement | Cajun | Peruvian |
| Minimum | 0.021% | 0.17% |
| Maximum | 3.3% | 11.8% |
| Range | 3.3% | 11.6% |
| Mean | 0.98% | 1.8% |
| Median | 0.90% | 1.6% |
| Interquartile 25% (IQ1) | 0.47% | 1.0% |
| Interquartile 75% (IQ3) | 1.4% | 2.1% |
| Interquartile Range (IQR) | 0.92% | 1.1% |
| Standard Deviation (Sample) | 0.65% | 1.6% |
| Standard Deviation (Population) | 0.65% | 1.5% |
Similar Demographics by Doctorate Degree
Demographics Similar to Cajuns by Doctorate Degree
In terms of doctorate degree, the demographic groups most similar to Cajuns are Cherokee (1.5%, a difference of 0.17%), Immigrants from El Salvador (1.4%, a difference of 0.18%), Cape Verdean (1.4%, a difference of 0.31%), Choctaw (1.4%, a difference of 0.33%), and Malaysian (1.5%, a difference of 0.34%).
| Demographics | Rating | Rank | Doctorate Degree |
| Ecuadorians | 0.4 /100 | #280 | Tragic 1.5% |
| Tohono O'odham | 0.4 /100 | #281 | Tragic 1.5% |
| British West Indians | 0.3 /100 | #282 | Tragic 1.5% |
| Central Americans | 0.3 /100 | #283 | Tragic 1.5% |
| Jamaicans | 0.3 /100 | #284 | Tragic 1.5% |
| Malaysians | 0.3 /100 | #285 | Tragic 1.5% |
| Cherokee | 0.3 /100 | #286 | Tragic 1.5% |
| Cajuns | 0.3 /100 | #287 | Tragic 1.5% |
| Immigrants | El Salvador | 0.3 /100 | #288 | Tragic 1.4% |
| Cape Verdeans | 0.3 /100 | #289 | Tragic 1.4% |
| Choctaw | 0.3 /100 | #290 | Tragic 1.4% |
| Blacks/African Americans | 0.3 /100 | #291 | Tragic 1.4% |
| Alaska Natives | 0.3 /100 | #292 | Tragic 1.4% |
| Immigrants | Yemen | 0.2 /100 | #293 | Tragic 1.4% |
| Samoans | 0.2 /100 | #294 | Tragic 1.4% |
Demographics Similar to Peruvians by Doctorate Degree
In terms of doctorate degree, the demographic groups most similar to Peruvians are Czechoslovakian (1.8%, a difference of 0.23%), Slovak (1.8%, a difference of 0.32%), German (1.8%, a difference of 0.68%), French Canadian (1.8%, a difference of 0.72%), and Immigrants from Costa Rica (1.8%, a difference of 0.73%).
| Demographics | Rating | Rank | Doctorate Degree |
| Ghanaians | 48.3 /100 | #179 | Average 1.8% |
| Scandinavians | 48.0 /100 | #180 | Average 1.8% |
| Immigrants | Immigrants | 46.2 /100 | #181 | Average 1.8% |
| Immigrants | Afghanistan | 44.3 /100 | #182 | Average 1.8% |
| Finns | 42.1 /100 | #183 | Average 1.8% |
| Nigerians | 39.9 /100 | #184 | Fair 1.8% |
| Slovaks | 36.4 /100 | #185 | Fair 1.8% |
| Peruvians | 34.4 /100 | #186 | Fair 1.8% |
| Czechoslovakians | 33.0 /100 | #187 | Fair 1.8% |
| Germans | 30.5 /100 | #188 | Fair 1.8% |
| French Canadians | 30.2 /100 | #189 | Fair 1.8% |
| Immigrants | Costa Rica | 30.2 /100 | #190 | Fair 1.8% |
| South Americans | 29.5 /100 | #191 | Fair 1.8% |
| Dutch | 27.4 /100 | #192 | Fair 1.8% |
| German Russians | 27.1 /100 | #193 | Fair 1.8% |