Cajun vs Immigrants from Afghanistan High School Diploma

COMPARE

Cajun
Race
Ancestry
AfghanAfricanAlaska NativeAlaskan AthabascanAlbanianAleutAlsatianAmericanApacheArabArapahoArgentineanArmenianAssyrian/Chaldean/SyriacAustralianAustrianBahamianBangladeshiBarbadianBasqueBelgianBelizeanBermudanBhutaneseBlackfeetBolivianBrazilianBritishBritish West IndianBulgarianBurmeseCajunCambodianCanadianCape VerdeanCarpatho RusynCelticCentral AmericanCentral American IndianCherokeeCheyenneChickasawChileanChineseChippewaChoctawColombianColvilleComancheCosta RicanCreeCreekCroatianCrowCubanCypriotCzechCzechoslovakianDanishDelawareDominicanDutchDutch West IndianEastern EuropeanEcuadorianEgyptianEnglishEstonianEthiopianEuropeanFijianFilipinoFinnishFrenchFrench American IndianFrench CanadianGermanGerman RussianGhanaianGreekGuamanian/ChamorroGuatemalanGuyaneseHaitianHmongHonduranHopiHoumaHungarianIcelanderIndian (Asian)IndonesianInupiatIranianIraqiIrishIroquoisIsraeliItalianJamaicanJapaneseJordanianKenyanKiowaKoreanLaotianLatvianLebaneseLiberianLithuanianLumbeeLuxembourgerMacedonianMalaysianMalteseMarshalleseMenomineeMexicanMexican American IndianMongolianMoroccanNative HawaiianNavajoNepaleseNew ZealanderNicaraguanNigerianNorthern EuropeanNorwegianOkinawanOsageOttawaPaiutePakistaniPalestinianPanamanianParaguayanPennsylvania GermanPeruvianPimaPolishPortuguesePotawatomiPuebloPuerto RicanPuget Sound SalishRomanianRussianSalvadoranSamoanScandinavianScotch-IrishScottishSeminoleSenegaleseSerbianShoshoneSierra LeoneanSiouxSlavicSlovakSloveneSomaliSouth AfricanSouth AmericanSouth American IndianSoviet UnionSpaniardSpanishSpanish AmericanSpanish American IndianSri LankanSubsaharan AfricanSudaneseSwedishSwissSyrianTaiwaneseThaiTlingit-HaidaTohono O'OdhamTonganTrinidadian and TobagonianTsimshianTurkishU.S. Virgin IslanderUgandanUkrainianUruguayanUteVenezuelanVietnameseWelshWest IndianYakamaYaquiYugoslavianYumanYup'ikZimbabwean
Immigration
NonimmigrantsImmigrantsAfricaAlbaniaArgentinaArmeniaAsiaAustraliaAustriaBahamasBangladeshBarbadosBelarusBelgiumBelizeBoliviaBosnia and HerzegovinaBrazilBulgariaBurma/MyanmarCabo VerdeCambodiaCameroonCanadaCaribbeanCentral AmericaChileChinaColombiaCongoCosta RicaCroatiaCubaCzechoslovakiaDenmarkDominicaDominican RepublicEastern AfricaEastern AsiaEastern EuropeEcuadorEgyptEl SalvadorEnglandEritreaEthiopiaEuropeFijiFranceGermanyGhanaGreeceGrenadaGuatemalaGuyanaHaitiHondurasHong KongHungaryIndiaIndonesiaIranIraqIrelandIsraelItalyJamaicaJapanJordanKazakhstanKenyaKoreaKuwaitLaosLatin AmericaLatviaLebanonLiberiaLithuaniaMalaysiaMexicoMicronesiaMiddle AfricaMoldovaMoroccoNepalNetherlandsNicaraguaNigeriaNorth AmericaNorth MacedoniaNorthern AfricaNorthern EuropeNorwayOceaniaPakistanPanamaPeruPhilippinesPolandPortugalRomaniaRussiaSaudi ArabiaScotlandSenegalSerbiaSierra LeoneSingaporeSomaliaSouth AfricaSouth AmericaSouth Central AsiaSouth Eastern AsiaSouthern EuropeSpainSri LankaSt. Vincent and the GrenadinesSudanSwedenSwitzerlandSyriaTaiwanThailandTrinidad and TobagoTurkeyUgandaUkraineUruguayUzbekistanVenezuelaVietnamWest IndiesWestern AfricaWestern AsiaWestern EuropeYemenZaireZimbabweAzores
Immigrants from Afghanistan
Race
Ancestry
AfghanAfricanAlaska NativeAlaskan AthabascanAlbanianAleutAlsatianAmericanApacheArabArapahoArgentineanArmenianAssyrian/Chaldean/SyriacAustralianAustrianBahamianBangladeshiBarbadianBasqueBelgianBelizeanBermudanBhutaneseBlackfeetBolivianBrazilianBritishBritish West IndianBulgarianBurmeseCambodianCanadianCape VerdeanCarpatho RusynCelticCentral AmericanCentral American IndianCherokeeCheyenneChickasawChileanChineseChippewaChoctawColombianColvilleComancheCosta RicanCreeCreekCroatianCrowCubanCypriotCzechCzechoslovakianDanishDelawareDominicanDutchDutch West IndianEastern EuropeanEcuadorianEgyptianEnglishEstonianEthiopianEuropeanFijianFilipinoFinnishFrenchFrench American IndianFrench CanadianGermanGerman RussianGhanaianGreekGuamanian/ChamorroGuatemalanGuyaneseHaitianHmongHonduranHopiHoumaHungarianIcelanderIndian (Asian)IndonesianInupiatIranianIraqiIrishIroquoisIsraeliItalianJamaicanJapaneseJordanianKenyanKiowaKoreanLaotianLatvianLebaneseLiberianLithuanianLumbeeLuxembourgerMacedonianMalaysianMalteseMarshalleseMenomineeMexicanMexican American IndianMongolianMoroccanNative HawaiianNavajoNepaleseNew ZealanderNicaraguanNigerianNorthern EuropeanNorwegianOkinawanOsageOttawaPaiutePakistaniPalestinianPanamanianParaguayanPennsylvania GermanPeruvianPimaPolishPortuguesePotawatomiPuebloPuerto RicanPuget Sound SalishRomanianRussianSalvadoranSamoanScandinavianScotch-IrishScottishSeminoleSenegaleseSerbianShoshoneSierra LeoneanSiouxSlavicSlovakSloveneSomaliSouth AfricanSouth AmericanSouth American IndianSoviet UnionSpaniardSpanishSpanish AmericanSpanish American IndianSri LankanSubsaharan AfricanSudaneseSwedishSwissSyrianTaiwaneseThaiTlingit-HaidaTohono O'OdhamTonganTrinidadian and TobagonianTsimshianTurkishU.S. Virgin IslanderUgandanUkrainianUruguayanUteVenezuelanVietnameseWelshWest IndianYakamaYaquiYugoslavianYumanYup'ikZimbabwean
Immigration
NonimmigrantsImmigrantsAfghanistanAfricaAlbaniaArgentinaArmeniaAsiaAustraliaAustriaBahamasBangladeshBarbadosBelarusBelgiumBelizeBoliviaBosnia and HerzegovinaBrazilBulgariaBurma/MyanmarCabo VerdeCambodiaCameroonCanadaCaribbeanCentral AmericaChileChinaColombiaCongoCosta RicaCroatiaCubaCzechoslovakiaDenmarkDominicaDominican RepublicEastern AfricaEastern AsiaEastern EuropeEcuadorEgyptEl SalvadorEnglandEritreaEthiopiaEuropeFijiFranceGermanyGhanaGreeceGrenadaGuatemalaGuyanaHaitiHondurasHong KongHungaryIndiaIndonesiaIranIraqIrelandIsraelItalyJamaicaJapanJordanKazakhstanKenyaKoreaKuwaitLaosLatin AmericaLatviaLebanonLiberiaLithuaniaMalaysiaMexicoMicronesiaMiddle AfricaMoldovaMoroccoNepalNetherlandsNicaraguaNigeriaNorth AmericaNorth MacedoniaNorthern AfricaNorthern EuropeNorwayOceaniaPakistanPanamaPeruPhilippinesPolandPortugalRomaniaRussiaSaudi ArabiaScotlandSenegalSerbiaSierra LeoneSingaporeSomaliaSouth AfricaSouth AmericaSouth Central AsiaSouth Eastern AsiaSouthern EuropeSpainSri LankaSt. Vincent and the GrenadinesSudanSwedenSwitzerlandSyriaTaiwanThailandTrinidad and TobagoTurkeyUgandaUkraineUruguayUzbekistanVenezuelaVietnamWest IndiesWestern AfricaWestern AsiaWestern EuropeYemenZaireZimbabweAzores
High School Diploma
Income
Poverty
Unemployment
Labor Participation
Family Structure
Vehicle Availability
Education Level
Disability

High School Diploma Comparison

Cajuns

Immigrants from Afghanistan

Tragic
Tragic
87.3%
HIGH SCHOOL DIPLOMA
0.4/ 100
METRIC RATING
260th/ 347
METRIC RANK
88.3%
HIGH SCHOOL DIPLOMA
8.6/ 100
METRIC RATING
221st/ 347
METRIC RANK

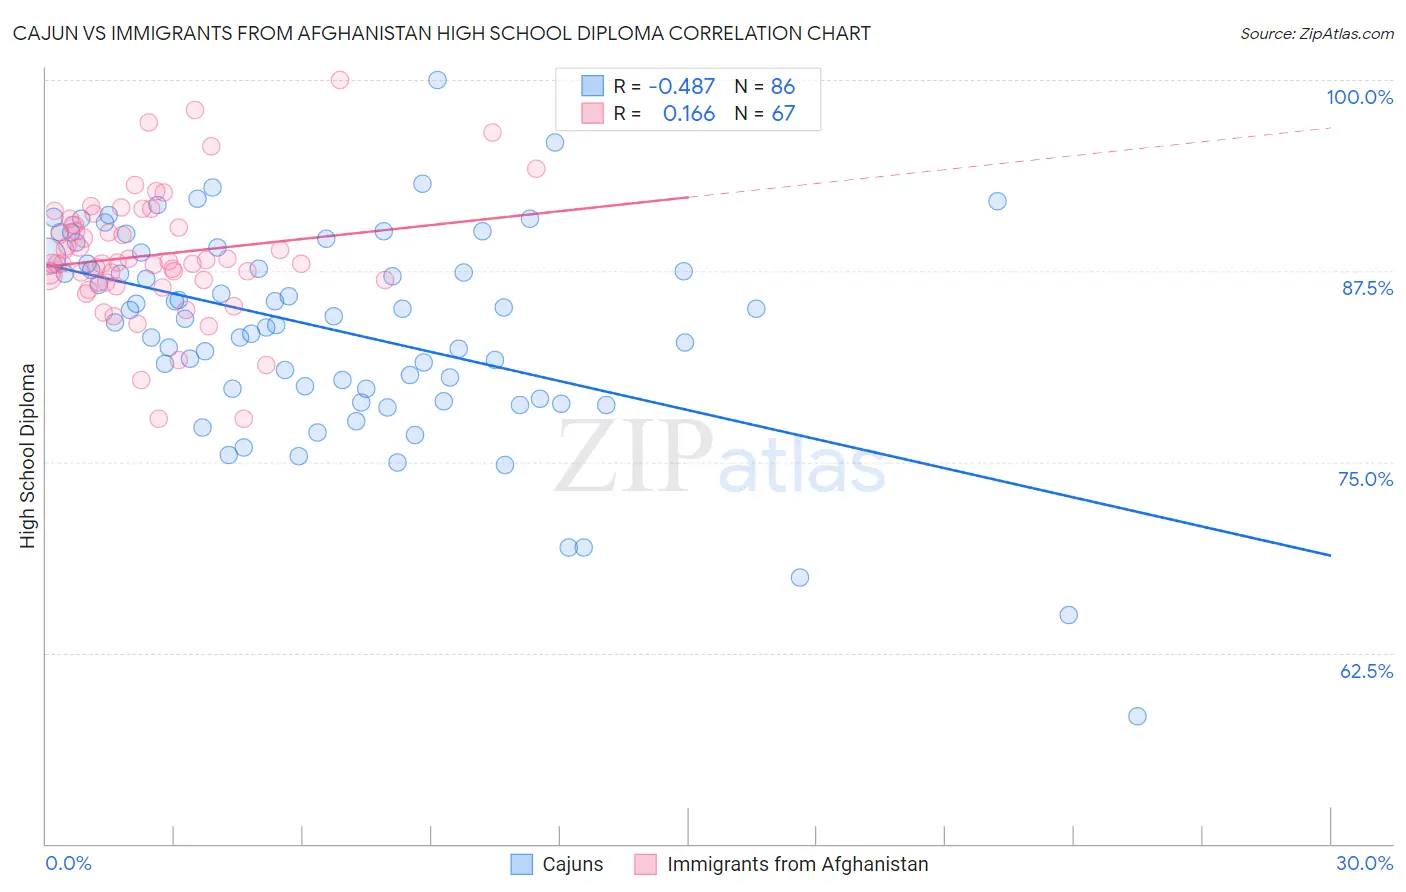
Cajun vs Immigrants from Afghanistan High School Diploma Correlation Chart

The statistical analysis conducted on geographies consisting of 149,713,149 people shows a moderate negative correlation between the proportion of Cajuns and percentage of population with at least high school diploma education in the United States with a correlation coefficient (R) of -0.487 and weighted average of 87.3%. Similarly, the statistical analysis conducted on geographies consisting of 147,629,579 people shows a poor positive correlation between the proportion of Immigrants from Afghanistan and percentage of population with at least high school diploma education in the United States with a correlation coefficient (R) of 0.166 and weighted average of 88.3%, a difference of 1.2%.
Cajun vs Immigrants from Afghanistan High School Diploma

High School Diploma Correlation Summary

MeasurementCajunImmigrants from Afghanistan
Minimum58.4%77.8%
Maximum100.0%100.0%
Range41.6%22.2%
Mean83.6%88.5%
Median84.5%88.0%
Interquartile 25% (IQ1)79.8%86.8%
Interquartile 75% (IQ3)88.4%90.5%
Interquartile Range (IQR)8.7%3.7%
Standard Deviation (Sample)6.9%4.1%
Standard Deviation (Population)6.8%4.1%

Similar Demographics by High School Diploma

Demographics Similar to Cajuns by High School Diploma

In terms of high school diploma, the demographic groups most similar to Cajuns are Seminole (87.3%, a difference of 0.020%), Immigrants from Peru (87.3%, a difference of 0.050%), Immigrants from Ghana (87.4%, a difference of 0.080%), Immigrants from Western Africa (87.4%, a difference of 0.080%), and Immigrants from South Eastern Asia (87.2%, a difference of 0.080%).
DemographicsRating | RankHigh School Diploma
Immigrants | Uruguay
1.0
/100
|
#253
Tragic
87.6%
Immigrants | Colombia
1.0
/100
|
#254
Tragic
87.6%
Immigrants | Senegal
0.9
/100
|
#255
Tragic
87.6%
Africans
0.7
/100
|
#256
Tragic
87.5%
Bahamians
0.7
/100
|
#257
Tragic
87.5%
Immigrants | Ghana
0.5
/100
|
#258
Tragic
87.4%
Immigrants | Western Africa
0.5
/100
|
#259
Tragic
87.4%
Cajuns
0.4
/100
|
#260
Tragic
87.3%
Seminole
0.4
/100
|
#261
Tragic
87.3%
Immigrants | Peru
0.4
/100
|
#262
Tragic
87.3%
Immigrants | South Eastern Asia
0.3
/100
|
#263
Tragic
87.2%
Jamaicans
0.3
/100
|
#264
Tragic
87.2%
U.S. Virgin Islanders
0.2
/100
|
#265
Tragic
87.1%
Immigrants | Congo
0.2
/100
|
#266
Tragic
87.0%
Blacks/African Americans
0.2
/100
|
#267
Tragic
87.0%

Demographics Similar to Immigrants from Afghanistan by High School Diploma

In terms of high school diploma, the demographic groups most similar to Immigrants from Afghanistan are Tongan (88.4%, a difference of 0.040%), Colville (88.3%, a difference of 0.040%), Costa Rican (88.4%, a difference of 0.050%), Immigrants from Zaire (88.3%, a difference of 0.050%), and Immigrants from Bolivia (88.4%, a difference of 0.070%).
DemographicsRating | RankHigh School Diploma
Immigrants | Cameroon
10.9
/100
|
#214
Poor
88.4%
Crow
10.9
/100
|
#215
Poor
88.4%
Chickasaw
10.7
/100
|
#216
Poor
88.4%
Immigrants | Africa
10.6
/100
|
#217
Poor
88.4%
Immigrants | Bolivia
10.3
/100
|
#218
Poor
88.4%
Costa Ricans
9.6
/100
|
#219
Tragic
88.4%
Tongans
9.5
/100
|
#220
Tragic
88.4%
Immigrants | Afghanistan
8.6
/100
|
#221
Tragic
88.3%
Colville
7.8
/100
|
#222
Tragic
88.3%
Immigrants | Zaire
7.6
/100
|
#223
Tragic
88.3%
Shoshone
7.0
/100
|
#224
Tragic
88.3%
Creek
6.9
/100
|
#225
Tragic
88.3%
Uruguayans
5.6
/100
|
#226
Tragic
88.2%
Immigrants | Liberia
5.5
/100
|
#227
Tragic
88.2%
Kiowa
5.3
/100
|
#228
Tragic
88.2%