Cajun vs Czech Kindergarten

COMPARE

Cajun
Race
Ancestry
AfghanAfricanAlaska NativeAlaskan AthabascanAlbanianAleutAlsatianAmericanApacheArabArapahoArgentineanArmenianAssyrian/Chaldean/SyriacAustralianAustrianBahamianBangladeshiBarbadianBasqueBelgianBelizeanBermudanBhutaneseBlackfeetBolivianBrazilianBritishBritish West IndianBulgarianBurmeseCajunCambodianCanadianCape VerdeanCarpatho RusynCelticCentral AmericanCentral American IndianCherokeeCheyenneChickasawChileanChineseChippewaChoctawColombianColvilleComancheCosta RicanCreeCreekCroatianCrowCubanCypriotCzechoslovakianDanishDelawareDominicanDutchDutch West IndianEastern EuropeanEcuadorianEgyptianEnglishEstonianEthiopianEuropeanFijianFilipinoFinnishFrenchFrench American IndianFrench CanadianGermanGerman RussianGhanaianGreekGuamanian/ChamorroGuatemalanGuyaneseHaitianHmongHonduranHopiHoumaHungarianIcelanderIndian (Asian)IndonesianInupiatIranianIraqiIrishIroquoisIsraeliItalianJamaicanJapaneseJordanianKenyanKiowaKoreanLaotianLatvianLebaneseLiberianLithuanianLumbeeLuxembourgerMacedonianMalaysianMalteseMarshalleseMenomineeMexicanMexican American IndianMongolianMoroccanNative HawaiianNavajoNepaleseNew ZealanderNicaraguanNigerianNorthern EuropeanNorwegianOkinawanOsageOttawaPaiutePakistaniPalestinianPanamanianParaguayanPennsylvania GermanPeruvianPimaPolishPortuguesePotawatomiPuebloPuerto RicanPuget Sound SalishRomanianRussianSalvadoranSamoanScandinavianScotch-IrishScottishSeminoleSenegaleseSerbianShoshoneSierra LeoneanSiouxSlavicSlovakSloveneSomaliSouth AfricanSouth AmericanSouth American IndianSoviet UnionSpaniardSpanishSpanish AmericanSpanish American IndianSri LankanSubsaharan AfricanSudaneseSwedishSwissSyrianTaiwaneseThaiTlingit-HaidaTohono O'OdhamTonganTrinidadian and TobagonianTsimshianTurkishU.S. Virgin IslanderUgandanUkrainianUruguayanUteVenezuelanVietnameseWelshWest IndianYakamaYaquiYugoslavianYumanYup'ikZimbabwean
Immigration
NonimmigrantsImmigrantsAfghanistanAfricaAlbaniaArgentinaArmeniaAsiaAustraliaAustriaBahamasBangladeshBarbadosBelarusBelgiumBelizeBoliviaBosnia and HerzegovinaBrazilBulgariaBurma/MyanmarCabo VerdeCambodiaCameroonCanadaCaribbeanCentral AmericaChileChinaColombiaCongoCosta RicaCroatiaCubaCzechoslovakiaDenmarkDominicaDominican RepublicEastern AfricaEastern AsiaEastern EuropeEcuadorEgyptEl SalvadorEnglandEritreaEthiopiaEuropeFijiFranceGermanyGhanaGreeceGrenadaGuatemalaGuyanaHaitiHondurasHong KongHungaryIndiaIndonesiaIranIraqIrelandIsraelItalyJamaicaJapanJordanKazakhstanKenyaKoreaKuwaitLaosLatin AmericaLatviaLebanonLiberiaLithuaniaMalaysiaMexicoMicronesiaMiddle AfricaMoldovaMoroccoNepalNetherlandsNicaraguaNigeriaNorth AmericaNorth MacedoniaNorthern AfricaNorthern EuropeNorwayOceaniaPakistanPanamaPeruPhilippinesPolandPortugalRomaniaRussiaSaudi ArabiaScotlandSenegalSerbiaSierra LeoneSingaporeSomaliaSouth AfricaSouth AmericaSouth Central AsiaSouth Eastern AsiaSouthern EuropeSpainSri LankaSt. Vincent and the GrenadinesSudanSwedenSwitzerlandSyriaTaiwanThailandTrinidad and TobagoTurkeyUgandaUkraineUruguayUzbekistanVenezuelaVietnamWest IndiesWestern AfricaWestern AsiaWestern EuropeYemenZaireZimbabweAzores
Czech
Race
Ancestry
AfghanAfricanAlaska NativeAlaskan AthabascanAlbanianAleutAlsatianAmericanApacheArabArapahoArgentineanArmenianAssyrian/Chaldean/SyriacAustralianAustrianBahamianBangladeshiBarbadianBasqueBelgianBelizeanBermudanBhutaneseBlackfeetBolivianBrazilianBritishBritish West IndianBulgarianBurmeseCambodianCanadianCape VerdeanCarpatho RusynCelticCentral AmericanCentral American IndianCherokeeCheyenneChickasawChileanChineseChippewaChoctawColombianColvilleComancheCosta RicanCreeCreekCroatianCrowCubanCypriotCzechCzechoslovakianDanishDelawareDominicanDutchDutch West IndianEastern EuropeanEcuadorianEgyptianEnglishEstonianEthiopianEuropeanFijianFilipinoFinnishFrenchFrench American IndianFrench CanadianGermanGerman RussianGhanaianGreekGuamanian/ChamorroGuatemalanGuyaneseHaitianHmongHonduranHopiHoumaHungarianIcelanderIndian (Asian)IndonesianInupiatIranianIraqiIrishIroquoisIsraeliItalianJamaicanJapaneseJordanianKenyanKiowaKoreanLaotianLatvianLebaneseLiberianLithuanianLumbeeLuxembourgerMacedonianMalaysianMalteseMarshalleseMenomineeMexicanMexican American IndianMongolianMoroccanNative HawaiianNavajoNepaleseNew ZealanderNicaraguanNigerianNorthern EuropeanNorwegianOkinawanOsageOttawaPaiutePakistaniPalestinianPanamanianParaguayanPennsylvania GermanPeruvianPimaPolishPortuguesePotawatomiPuebloPuerto RicanPuget Sound SalishRomanianRussianSalvadoranSamoanScandinavianScotch-IrishScottishSeminoleSenegaleseSerbianShoshoneSierra LeoneanSiouxSlavicSlovakSloveneSomaliSouth AfricanSouth AmericanSouth American IndianSoviet UnionSpaniardSpanishSpanish AmericanSpanish American IndianSri LankanSubsaharan AfricanSudaneseSwedishSwissSyrianTaiwaneseThaiTlingit-HaidaTohono O'OdhamTonganTrinidadian and TobagonianTsimshianTurkishU.S. Virgin IslanderUgandanUkrainianUruguayanUteVenezuelanVietnameseWelshWest IndianYakamaYaquiYugoslavianYumanYup'ikZimbabwean
Immigration
NonimmigrantsImmigrantsAfghanistanAfricaAlbaniaArgentinaArmeniaAsiaAustraliaAustriaBahamasBangladeshBarbadosBelarusBelgiumBelizeBoliviaBosnia and HerzegovinaBrazilBulgariaBurma/MyanmarCabo VerdeCambodiaCameroonCanadaCaribbeanCentral AmericaChileChinaColombiaCongoCosta RicaCroatiaCubaCzechoslovakiaDenmarkDominicaDominican RepublicEastern AfricaEastern AsiaEastern EuropeEcuadorEgyptEl SalvadorEnglandEritreaEthiopiaEuropeFijiFranceGermanyGhanaGreeceGrenadaGuatemalaGuyanaHaitiHondurasHong KongHungaryIndiaIndonesiaIranIraqIrelandIsraelItalyJamaicaJapanJordanKazakhstanKenyaKoreaKuwaitLaosLatin AmericaLatviaLebanonLiberiaLithuaniaMalaysiaMexicoMicronesiaMiddle AfricaMoldovaMoroccoNepalNetherlandsNicaraguaNigeriaNorth AmericaNorth MacedoniaNorthern AfricaNorthern EuropeNorwayOceaniaPakistanPanamaPeruPhilippinesPolandPortugalRomaniaRussiaSaudi ArabiaScotlandSenegalSerbiaSierra LeoneSingaporeSomaliaSouth AfricaSouth AmericaSouth Central AsiaSouth Eastern AsiaSouthern EuropeSpainSri LankaSt. Vincent and the GrenadinesSudanSwedenSwitzerlandSyriaTaiwanThailandTrinidad and TobagoTurkeyUgandaUkraineUruguayUzbekistanVenezuelaVietnamWest IndiesWestern AfricaWestern AsiaWestern EuropeYemenZaireZimbabweAzores
Kindergarten
Income
Poverty
Unemployment
Labor Participation
Family Structure
Vehicle Availability
Education Level
Disability

Kindergarten Comparison

Cajuns

Czechs

Exceptional
Exceptional
98.3%
KINDERGARTEN
99.4/ 100
METRIC RATING
73rd/ 347
METRIC RANK
98.6%
KINDERGARTEN
100.0/ 100
METRIC RATING
31st/ 347
METRIC RANK

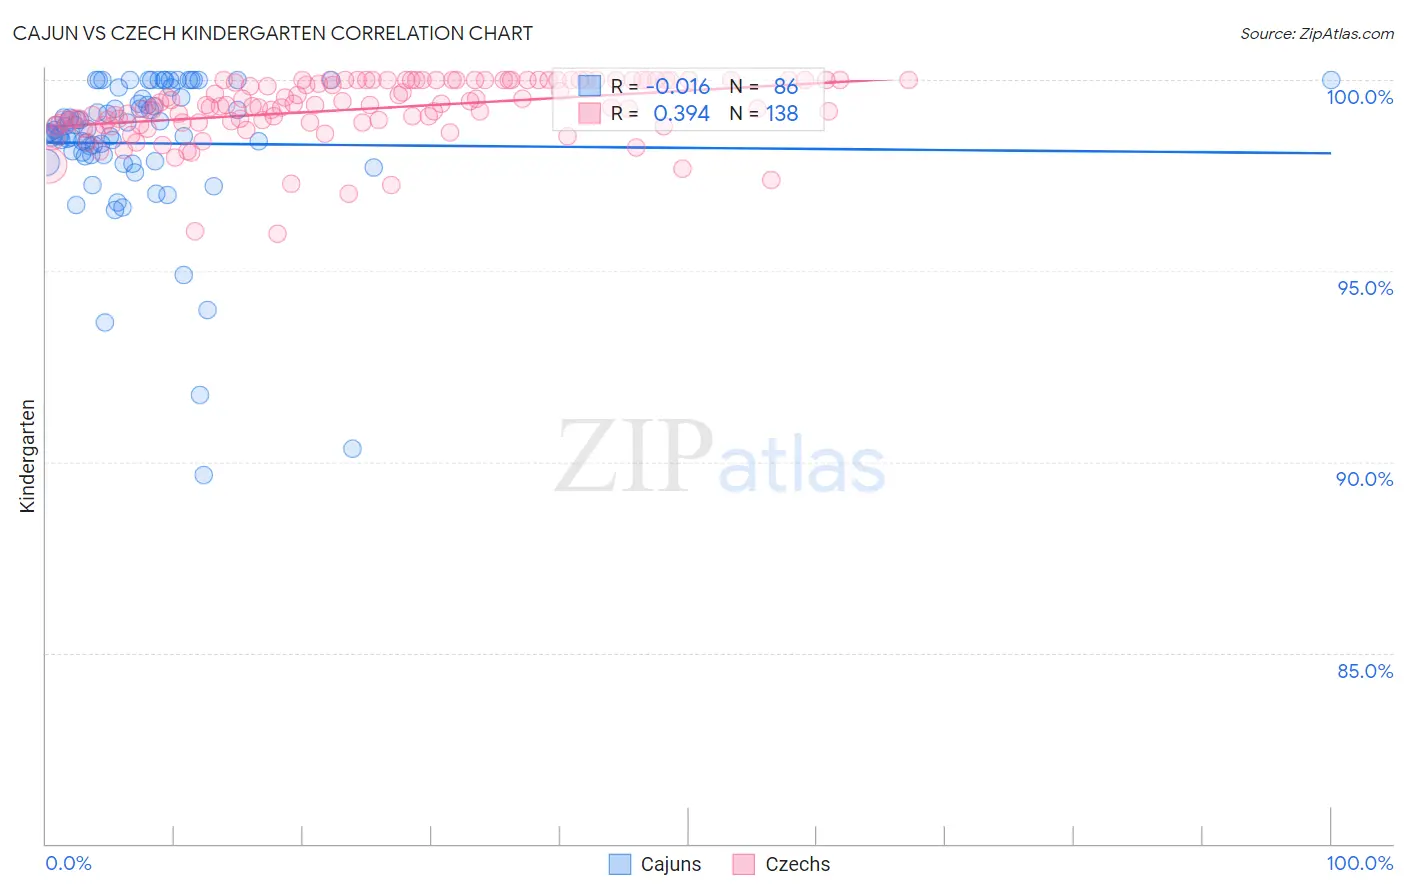
Cajun vs Czech Kindergarten Correlation Chart

The statistical analysis conducted on geographies consisting of 149,712,957 people shows no correlation between the proportion of Cajuns and percentage of population with at least kindergarten education in the United States with a correlation coefficient (R) of -0.016 and weighted average of 98.3%. Similarly, the statistical analysis conducted on geographies consisting of 484,813,102 people shows a mild positive correlation between the proportion of Czechs and percentage of population with at least kindergarten education in the United States with a correlation coefficient (R) of 0.394 and weighted average of 98.6%, a difference of 0.24%.
Cajun vs Czech Kindergarten

Kindergarten Correlation Summary

MeasurementCajunCzech
Minimum89.7%96.0%
Maximum100.0%100.0%
Range10.3%4.0%
Mean98.3%99.2%
Median98.7%99.3%
Interquartile 25% (IQ1)98.0%98.9%
Interquartile 75% (IQ3)99.5%100.0%
Interquartile Range (IQR)1.5%1.1%
Standard Deviation (Sample)1.9%0.80%
Standard Deviation (Population)1.9%0.79%

Similar Demographics by Kindergarten

Demographics Similar to Cajuns by Kindergarten

In terms of kindergarten, the demographic groups most similar to Cajuns are Immigrants from Netherlands (98.3%, a difference of 0.010%), Cherokee (98.3%, a difference of 0.010%), Immigrants from England (98.3%, a difference of 0.010%), Delaware (98.3%, a difference of 0.020%), and Shoshone (98.3%, a difference of 0.020%).
DemographicsRating | RankKindergarten
Cheyenne
99.6
/100
|
#66
Exceptional
98.4%
Canadians
99.6
/100
|
#67
Exceptional
98.4%
Immigrants | Northern Europe
99.6
/100
|
#68
Exceptional
98.4%
Immigrants | Austria
99.6
/100
|
#69
Exceptional
98.4%
Russians
99.6
/100
|
#70
Exceptional
98.4%
Chickasaw
99.6
/100
|
#71
Exceptional
98.4%
Serbians
99.6
/100
|
#72
Exceptional
98.4%
Cajuns
99.4
/100
|
#73
Exceptional
98.3%
Immigrants | Netherlands
99.3
/100
|
#74
Exceptional
98.3%
Cherokee
99.3
/100
|
#75
Exceptional
98.3%
Immigrants | England
99.3
/100
|
#76
Exceptional
98.3%
Delaware
99.3
/100
|
#77
Exceptional
98.3%
Shoshone
99.2
/100
|
#78
Exceptional
98.3%
Immigrants | Belgium
99.2
/100
|
#79
Exceptional
98.3%
Immigrants | Lithuania
99.2
/100
|
#80
Exceptional
98.3%

Demographics Similar to Czechs by Kindergarten

In terms of kindergarten, the demographic groups most similar to Czechs are European (98.6%, a difference of 0.0%), French Canadian (98.6%, a difference of 0.0%), Croatian (98.6%, a difference of 0.010%), French (98.6%, a difference of 0.010%), and Scandinavian (98.6%, a difference of 0.010%).
DemographicsRating | RankKindergarten
Danes
100.0
/100
|
#24
Exceptional
98.6%
Sioux
100.0
/100
|
#25
Exceptional
98.6%
Poles
100.0
/100
|
#26
Exceptional
98.6%
Scotch-Irish
100.0
/100
|
#27
Exceptional
98.6%
Croatians
100.0
/100
|
#28
Exceptional
98.6%
French
100.0
/100
|
#29
Exceptional
98.6%
Europeans
100.0
/100
|
#30
Exceptional
98.6%
Czechs
100.0
/100
|
#31
Exceptional
98.6%
French Canadians
100.0
/100
|
#32
Exceptional
98.6%
Scandinavians
100.0
/100
|
#33
Exceptional
98.6%
Chinese
100.0
/100
|
#34
Exceptional
98.5%
Swiss
100.0
/100
|
#35
Exceptional
98.5%
British
99.9
/100
|
#36
Exceptional
98.5%
Italians
99.9
/100
|
#37
Exceptional
98.5%
Latvians
99.9
/100
|
#38
Exceptional
98.5%