Cajun vs American 10th Grade
COMPARE
Cajun
American
10th Grade
10th Grade Comparison
Cajuns
Americans
93.4%
10TH GRADE
16.9/ 100
METRIC RATING
211th/ 347
METRIC RANK
94.3%
10TH GRADE
94.4/ 100
METRIC RATING
125th/ 347
METRIC RANK
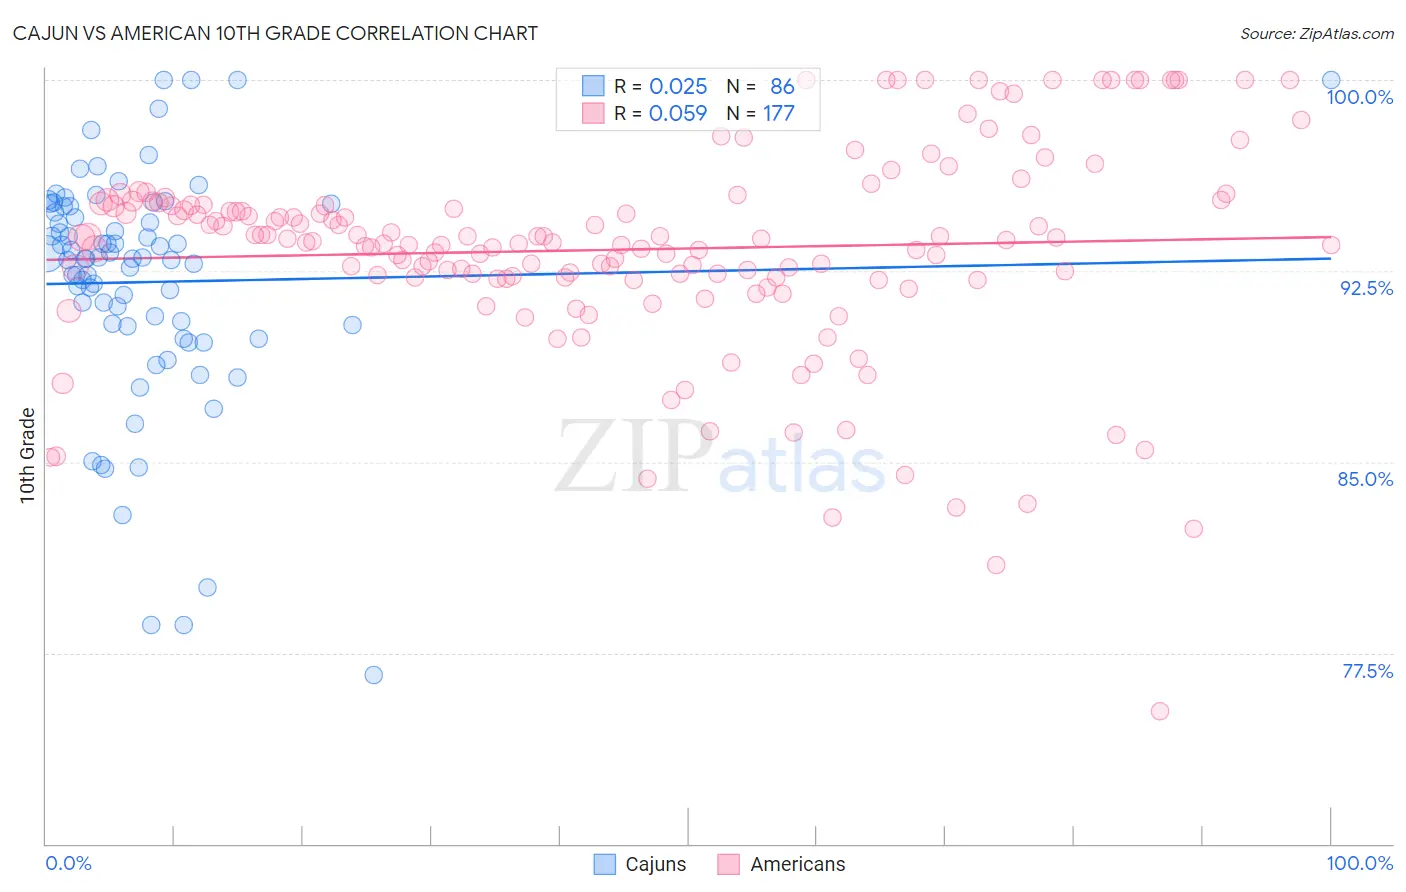
Cajun vs American 10th Grade Correlation Chart
The statistical analysis conducted on geographies consisting of 149,712,957 people shows no correlation between the proportion of Cajuns and percentage of population with at least 10th grade education in the United States with a correlation coefficient (R) of 0.025 and weighted average of 93.4%. Similarly, the statistical analysis conducted on geographies consisting of 581,993,132 people shows a slight positive correlation between the proportion of Americans and percentage of population with at least 10th grade education in the United States with a correlation coefficient (R) of 0.059 and weighted average of 94.3%, a difference of 0.99%.
10th Grade Correlation Summary
| Measurement | Cajun | American |
| Minimum | 76.6% | 75.2% |
| Maximum | 100.0% | 100.0% |
| Range | 23.4% | 24.8% |
| Mean | 92.1% | 93.3% |
| Median | 93.0% | 93.7% |
| Interquartile 25% (IQ1) | 90.4% | 92.2% |
| Interquartile 75% (IQ3) | 95.0% | 95.1% |
| Interquartile Range (IQR) | 4.7% | 2.9% |
| Standard Deviation (Sample) | 4.6% | 4.0% |
| Standard Deviation (Population) | 4.6% | 4.0% |
Similar Demographics by 10th Grade
Demographics Similar to Cajuns by 10th Grade
In terms of 10th grade, the demographic groups most similar to Cajuns are Immigrants from Zaire (93.4%, a difference of 0.0%), Indian (Asian) (93.4%, a difference of 0.010%), Immigrants from Asia (93.4%, a difference of 0.020%), Immigrants from Chile (93.4%, a difference of 0.030%), and Immigrants from Bahamas (93.4%, a difference of 0.030%).
| Demographics | Rating | Rank | 10th Grade |
| Ute | 20.3 /100 | #204 | Fair 93.4% |
| Immigrants | Indonesia | 20.2 /100 | #205 | Fair 93.4% |
| Immigrants | Sudan | 20.0 /100 | #206 | Fair 93.4% |
| Samoans | 19.5 /100 | #207 | Poor 93.4% |
| Immigrants | Syria | 19.4 /100 | #208 | Poor 93.4% |
| Immigrants | Chile | 18.8 /100 | #209 | Poor 93.4% |
| Indians (Asian) | 17.6 /100 | #210 | Poor 93.4% |
| Cajuns | 16.9 /100 | #211 | Poor 93.4% |
| Immigrants | Zaire | 16.7 /100 | #212 | Poor 93.4% |
| Immigrants | Asia | 15.7 /100 | #213 | Poor 93.4% |
| Immigrants | Bahamas | 15.2 /100 | #214 | Poor 93.4% |
| Immigrants | Oceania | 15.1 /100 | #215 | Poor 93.4% |
| Immigrants | Eastern Africa | 14.7 /100 | #216 | Poor 93.4% |
| Portuguese | 12.1 /100 | #217 | Poor 93.3% |
| Immigrants | Liberia | 10.2 /100 | #218 | Poor 93.3% |
Demographics Similar to Americans by 10th Grade
In terms of 10th grade, the demographic groups most similar to Americans are Immigrants from Iran (94.3%, a difference of 0.0%), Basque (94.3%, a difference of 0.020%), Israeli (94.3%, a difference of 0.020%), Inupiat (94.4%, a difference of 0.030%), and Cree (94.4%, a difference of 0.030%).
| Demographics | Rating | Rank | 10th Grade |
| Jordanians | 95.6 /100 | #118 | Exceptional 94.4% |
| Immigrants | Israel | 95.4 /100 | #119 | Exceptional 94.4% |
| Immigrants | Taiwan | 95.3 /100 | #120 | Exceptional 94.4% |
| Immigrants | Belarus | 95.2 /100 | #121 | Exceptional 94.4% |
| Inupiat | 95.1 /100 | #122 | Exceptional 94.4% |
| Cree | 95.1 /100 | #123 | Exceptional 94.4% |
| Basques | 94.9 /100 | #124 | Exceptional 94.3% |
| Americans | 94.4 /100 | #125 | Exceptional 94.3% |
| Immigrants | Iran | 94.4 /100 | #126 | Exceptional 94.3% |
| Israelis | 93.8 /100 | #127 | Exceptional 94.3% |
| Potawatomi | 93.6 /100 | #128 | Exceptional 94.3% |
| Iroquois | 92.8 /100 | #129 | Exceptional 94.3% |
| Immigrants | Greece | 92.7 /100 | #130 | Exceptional 94.3% |
| Immigrants | Eastern Europe | 92.5 /100 | #131 | Exceptional 94.3% |
| Immigrants | Russia | 92.4 /100 | #132 | Exceptional 94.3% |