Burmese vs Ethiopian 6th Grade

COMPARE

Burmese
Race
Ancestry
AfghanAfricanAlaska NativeAlaskan AthabascanAlbanianAleutAlsatianAmericanApacheArabArapahoArgentineanArmenianAssyrian/Chaldean/SyriacAustralianAustrianBahamianBangladeshiBarbadianBasqueBelgianBelizeanBermudanBhutaneseBlackfeetBolivianBrazilianBritishBritish West IndianBulgarianBurmeseCajunCambodianCanadianCape VerdeanCarpatho RusynCelticCentral AmericanCentral American IndianCherokeeCheyenneChickasawChileanChineseChippewaChoctawColombianColvilleComancheCosta RicanCreeCreekCroatianCrowCubanCypriotCzechCzechoslovakianDanishDelawareDominicanDutchDutch West IndianEastern EuropeanEcuadorianEgyptianEnglishEstonianEuropeanFijianFilipinoFinnishFrenchFrench American IndianFrench CanadianGermanGerman RussianGhanaianGreekGuamanian/ChamorroGuatemalanGuyaneseHaitianHmongHonduranHopiHoumaHungarianIcelanderIndian (Asian)IndonesianInupiatIranianIraqiIrishIroquoisIsraeliItalianJamaicanJapaneseJordanianKenyanKiowaKoreanLaotianLatvianLebaneseLiberianLithuanianLumbeeLuxembourgerMacedonianMalaysianMalteseMarshalleseMenomineeMexicanMexican American IndianMongolianMoroccanNative HawaiianNavajoNepaleseNew ZealanderNicaraguanNigerianNorthern EuropeanNorwegianOkinawanOsageOttawaPaiutePakistaniPalestinianPanamanianParaguayanPennsylvania GermanPeruvianPimaPolishPortuguesePotawatomiPuebloPuerto RicanPuget Sound SalishRomanianRussianSalvadoranSamoanScandinavianScotch-IrishScottishSeminoleSenegaleseSerbianShoshoneSierra LeoneanSiouxSlavicSlovakSloveneSomaliSouth AfricanSouth AmericanSouth American IndianSoviet UnionSpaniardSpanishSpanish AmericanSpanish American IndianSri LankanSubsaharan AfricanSudaneseSwedishSwissSyrianTaiwaneseThaiTlingit-HaidaTohono O'OdhamTonganTrinidadian and TobagonianTsimshianTurkishU.S. Virgin IslanderUgandanUkrainianUruguayanUteVenezuelanVietnameseWelshWest IndianYakamaYaquiYugoslavianYumanYup'ikZimbabwean
Immigration
NonimmigrantsImmigrantsAfghanistanAfricaAlbaniaArgentinaArmeniaAsiaAustraliaAustriaBahamasBangladeshBarbadosBelarusBelgiumBelizeBoliviaBosnia and HerzegovinaBrazilBulgariaBurma/MyanmarCabo VerdeCambodiaCameroonCanadaCaribbeanCentral AmericaChileChinaColombiaCongoCosta RicaCroatiaCubaCzechoslovakiaDenmarkDominicaDominican RepublicEastern AfricaEastern AsiaEastern EuropeEcuadorEgyptEl SalvadorEnglandEritreaEthiopiaEuropeFijiFranceGermanyGhanaGreeceGrenadaGuatemalaGuyanaHaitiHondurasHong KongHungaryIndiaIndonesiaIranIraqIrelandIsraelItalyJamaicaJapanJordanKazakhstanKenyaKoreaKuwaitLaosLatin AmericaLatviaLebanonLiberiaLithuaniaMalaysiaMexicoMicronesiaMiddle AfricaMoldovaMoroccoNepalNetherlandsNicaraguaNigeriaNorth AmericaNorth MacedoniaNorthern AfricaNorthern EuropeNorwayOceaniaPakistanPanamaPeruPhilippinesPolandPortugalRomaniaRussiaSaudi ArabiaScotlandSenegalSerbiaSierra LeoneSingaporeSomaliaSouth AfricaSouth AmericaSouth Central AsiaSouth Eastern AsiaSouthern EuropeSpainSri LankaSt. Vincent and the GrenadinesSudanSwedenSwitzerlandSyriaTaiwanThailandTrinidad and TobagoTurkeyUgandaUkraineUruguayUzbekistanVenezuelaVietnamWest IndiesWestern AfricaWestern AsiaWestern EuropeYemenZaireZimbabweAzores
Ethiopian
Race
Ancestry
AfghanAfricanAlaska NativeAlaskan AthabascanAlbanianAleutAlsatianAmericanApacheArabArapahoArgentineanArmenianAssyrian/Chaldean/SyriacAustralianAustrianBahamianBangladeshiBarbadianBasqueBelgianBelizeanBermudanBhutaneseBlackfeetBolivianBrazilianBritishBritish West IndianBulgarianCajunCambodianCanadianCape VerdeanCarpatho RusynCelticCentral AmericanCentral American IndianCherokeeCheyenneChickasawChileanChineseChippewaChoctawColombianColvilleComancheCosta RicanCreeCreekCroatianCrowCubanCypriotCzechCzechoslovakianDanishDelawareDominicanDutchDutch West IndianEastern EuropeanEcuadorianEgyptianEnglishEstonianEthiopianEuropeanFijianFilipinoFinnishFrenchFrench American IndianFrench CanadianGermanGerman RussianGhanaianGreekGuamanian/ChamorroGuatemalanGuyaneseHaitianHmongHonduranHopiHoumaHungarianIcelanderIndian (Asian)IndonesianInupiatIranianIraqiIrishIroquoisIsraeliItalianJamaicanJapaneseJordanianKenyanKiowaKoreanLaotianLatvianLebaneseLiberianLithuanianLumbeeLuxembourgerMacedonianMalaysianMalteseMarshalleseMenomineeMexicanMexican American IndianMongolianMoroccanNative HawaiianNavajoNepaleseNew ZealanderNicaraguanNigerianNorthern EuropeanNorwegianOkinawanOsageOttawaPaiutePakistaniPalestinianPanamanianParaguayanPennsylvania GermanPeruvianPimaPolishPortuguesePotawatomiPuebloPuerto RicanPuget Sound SalishRomanianRussianSalvadoranSamoanScandinavianScotch-IrishScottishSeminoleSenegaleseSerbianShoshoneSierra LeoneanSiouxSlavicSlovakSloveneSomaliSouth AfricanSouth AmericanSouth American IndianSoviet UnionSpaniardSpanishSpanish AmericanSpanish American IndianSri LankanSubsaharan AfricanSudaneseSwedishSwissSyrianTaiwaneseThaiTlingit-HaidaTohono O'OdhamTonganTrinidadian and TobagonianTsimshianTurkishU.S. Virgin IslanderUgandanUkrainianUruguayanUteVenezuelanVietnameseWelshWest IndianYakamaYaquiYugoslavianYumanYup'ikZimbabwean
Immigration
NonimmigrantsImmigrantsAfghanistanAfricaAlbaniaArgentinaArmeniaAsiaAustraliaAustriaBahamasBangladeshBarbadosBelarusBelgiumBelizeBoliviaBosnia and HerzegovinaBrazilBulgariaBurma/MyanmarCabo VerdeCambodiaCameroonCanadaCaribbeanCentral AmericaChileChinaColombiaCongoCosta RicaCroatiaCubaCzechoslovakiaDenmarkDominicaDominican RepublicEastern AfricaEastern AsiaEastern EuropeEcuadorEgyptEl SalvadorEnglandEritreaEthiopiaEuropeFijiFranceGermanyGhanaGreeceGrenadaGuatemalaGuyanaHaitiHondurasHong KongHungaryIndiaIndonesiaIranIraqIrelandIsraelItalyJamaicaJapanJordanKazakhstanKenyaKoreaKuwaitLaosLatin AmericaLatviaLebanonLiberiaLithuaniaMalaysiaMexicoMicronesiaMiddle AfricaMoldovaMoroccoNepalNetherlandsNicaraguaNigeriaNorth AmericaNorth MacedoniaNorthern AfricaNorthern EuropeNorwayOceaniaPakistanPanamaPeruPhilippinesPolandPortugalRomaniaRussiaSaudi ArabiaScotlandSenegalSerbiaSierra LeoneSingaporeSomaliaSouth AfricaSouth AmericaSouth Central AsiaSouth Eastern AsiaSouthern EuropeSpainSri LankaSt. Vincent and the GrenadinesSudanSwedenSwitzerlandSyriaTaiwanThailandTrinidad and TobagoTurkeyUgandaUkraineUruguayUzbekistanVenezuelaVietnamWest IndiesWestern AfricaWestern AsiaWestern EuropeYemenZaireZimbabweAzores
6th Grade
Income
Poverty
Unemployment
Labor Participation
Family Structure
Vehicle Availability
Education Level
Disability

6th Grade Comparison

Burmese

Ethiopians

Excellent
Tragic
97.3%
6TH GRADE
87.8/ 100
METRIC RATING
137th/ 347
METRIC RANK
96.6%
6TH GRADE
1.5/ 100
METRIC RATING
244th/ 347
METRIC RANK

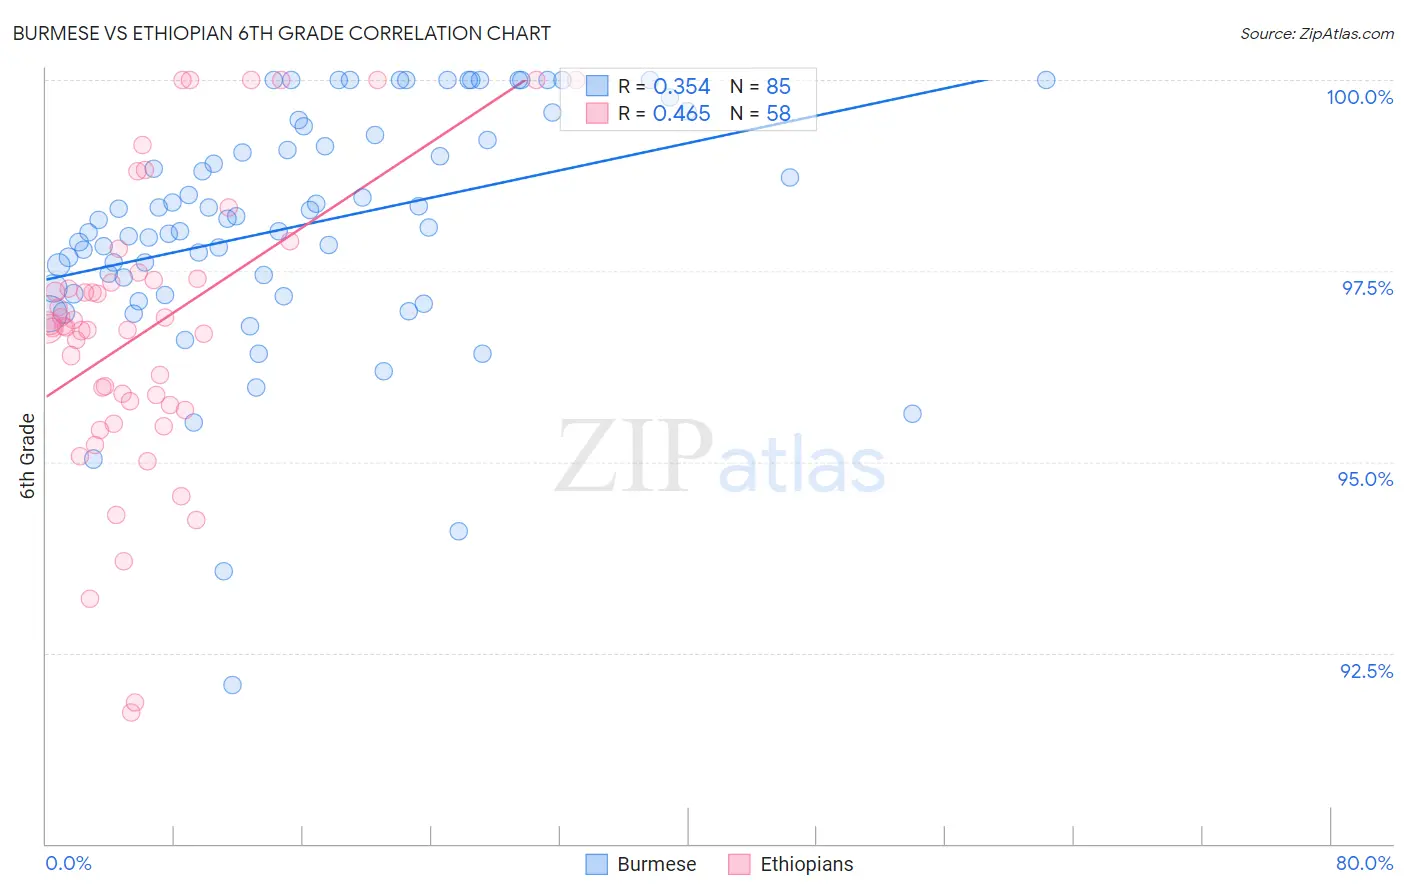
Burmese vs Ethiopian 6th Grade Correlation Chart

The statistical analysis conducted on geographies consisting of 465,275,994 people shows a mild positive correlation between the proportion of Burmese and percentage of population with at least 6th grade education in the United States with a correlation coefficient (R) of 0.354 and weighted average of 97.3%. Similarly, the statistical analysis conducted on geographies consisting of 223,120,541 people shows a moderate positive correlation between the proportion of Ethiopians and percentage of population with at least 6th grade education in the United States with a correlation coefficient (R) of 0.465 and weighted average of 96.6%, a difference of 0.71%.
Burmese vs Ethiopian 6th Grade

6th Grade Correlation Summary

MeasurementBurmeseEthiopian
Minimum92.1%91.7%
Maximum100.0%100.0%
Range7.9%8.3%
Mean98.1%96.7%
Median98.2%96.8%
Interquartile 25% (IQ1)97.2%95.7%
Interquartile 75% (IQ3)99.3%97.4%
Interquartile Range (IQR)2.1%1.7%
Standard Deviation (Sample)1.6%1.9%
Standard Deviation (Population)1.5%1.9%

Similar Demographics by 6th Grade

Demographics Similar to Burmese by 6th Grade

In terms of 6th grade, the demographic groups most similar to Burmese are Blackfeet (97.3%, a difference of 0.0%), Filipino (97.3%, a difference of 0.010%), Immigrants from Kuwait (97.3%, a difference of 0.020%), Immigrants from Hungary (97.3%, a difference of 0.020%), and Immigrants from Turkey (97.3%, a difference of 0.020%).
DemographicsRating | Rank6th Grade
Cambodians
91.8
/100
|
#130
Exceptional
97.3%
Immigrants | Europe
91.1
/100
|
#131
Exceptional
97.3%
Palestinians
90.9
/100
|
#132
Exceptional
97.3%
Immigrants | Moldova
90.0
/100
|
#133
Excellent
97.3%
Immigrants | Kuwait
89.5
/100
|
#134
Excellent
97.3%
Immigrants | Hungary
89.5
/100
|
#135
Excellent
97.3%
Filipinos
88.9
/100
|
#136
Excellent
97.3%
Burmese
87.8
/100
|
#137
Excellent
97.3%
Blackfeet
87.7
/100
|
#138
Excellent
97.3%
Immigrants | Turkey
86.1
/100
|
#139
Excellent
97.3%
Immigrants | North Macedonia
85.5
/100
|
#140
Excellent
97.2%
Seminole
84.8
/100
|
#141
Excellent
97.2%
Jordanians
84.6
/100
|
#142
Excellent
97.2%
Pima
82.9
/100
|
#143
Excellent
97.2%
Israelis
82.9
/100
|
#144
Excellent
97.2%

Demographics Similar to Ethiopians by 6th Grade

In terms of 6th grade, the demographic groups most similar to Ethiopians are Immigrants from Liberia (96.6%, a difference of 0.010%), Senegalese (96.6%, a difference of 0.020%), Immigrants from Asia (96.6%, a difference of 0.020%), Immigrants from Costa Rica (96.6%, a difference of 0.020%), and Immigrants from Africa (96.6%, a difference of 0.020%).
DemographicsRating | Rank6th Grade
Immigrants | Eastern Africa
2.0
/100
|
#237
Tragic
96.6%
Nigerians
1.9
/100
|
#238
Tragic
96.6%
Indians (Asian)
1.9
/100
|
#239
Tragic
96.6%
Koreans
1.9
/100
|
#240
Tragic
96.6%
Senegalese
1.8
/100
|
#241
Tragic
96.6%
Immigrants | Asia
1.8
/100
|
#242
Tragic
96.6%
Immigrants | Liberia
1.6
/100
|
#243
Tragic
96.6%
Ethiopians
1.5
/100
|
#244
Tragic
96.6%
Immigrants | Costa Rica
1.3
/100
|
#245
Tragic
96.6%
Immigrants | Africa
1.3
/100
|
#246
Tragic
96.6%
Bolivians
1.0
/100
|
#247
Tragic
96.5%
Tohono O'odham
1.0
/100
|
#248
Tragic
96.5%
Colombians
0.9
/100
|
#249
Tragic
96.5%
Immigrants | Middle Africa
0.8
/100
|
#250
Tragic
96.5%
Immigrants | Senegal
0.7
/100
|
#251
Tragic
96.5%