Burmese vs Cape Verdean Master's Degree

COMPARE

Burmese
Race
Ancestry
AfghanAfricanAlaska NativeAlaskan AthabascanAlbanianAleutAlsatianAmericanApacheArabArapahoArgentineanArmenianAssyrian/Chaldean/SyriacAustralianAustrianBahamianBangladeshiBarbadianBasqueBelgianBelizeanBermudanBhutaneseBlackfeetBolivianBrazilianBritishBritish West IndianBulgarianBurmeseCajunCambodianCanadianCarpatho RusynCelticCentral AmericanCentral American IndianCherokeeCheyenneChickasawChileanChineseChippewaChoctawColombianColvilleComancheCosta RicanCreeCreekCroatianCrowCubanCypriotCzechCzechoslovakianDanishDelawareDominicanDutchDutch West IndianEastern EuropeanEcuadorianEgyptianEnglishEstonianEthiopianEuropeanFijianFilipinoFinnishFrenchFrench American IndianFrench CanadianGermanGerman RussianGhanaianGreekGuamanian/ChamorroGuatemalanGuyaneseHaitianHmongHonduranHopiHoumaHungarianIcelanderIndian (Asian)IndonesianInupiatIranianIraqiIrishIroquoisIsraeliItalianJamaicanJapaneseJordanianKenyanKiowaKoreanLaotianLatvianLebaneseLiberianLithuanianLumbeeLuxembourgerMacedonianMalaysianMalteseMarshalleseMenomineeMexicanMexican American IndianMongolianMoroccanNative HawaiianNavajoNepaleseNew ZealanderNicaraguanNigerianNorthern EuropeanNorwegianOkinawanOsageOttawaPaiutePakistaniPalestinianPanamanianParaguayanPennsylvania GermanPeruvianPimaPolishPortuguesePotawatomiPuebloPuerto RicanPuget Sound SalishRomanianRussianSalvadoranSamoanScandinavianScotch-IrishScottishSeminoleSenegaleseSerbianShoshoneSierra LeoneanSiouxSlavicSlovakSloveneSomaliSouth AfricanSouth AmericanSouth American IndianSoviet UnionSpaniardSpanishSpanish AmericanSpanish American IndianSri LankanSubsaharan AfricanSudaneseSwedishSwissSyrianTaiwaneseThaiTlingit-HaidaTohono O'OdhamTonganTrinidadian and TobagonianTsimshianTurkishU.S. Virgin IslanderUgandanUkrainianUruguayanUteVenezuelanVietnameseWelshWest IndianYakamaYaquiYugoslavianYumanYup'ikZimbabwean
Immigration
NonimmigrantsImmigrantsAfghanistanAfricaAlbaniaArgentinaArmeniaAsiaAustraliaAustriaBahamasBangladeshBarbadosBelarusBelgiumBelizeBoliviaBosnia and HerzegovinaBrazilBulgariaBurma/MyanmarCabo VerdeCambodiaCameroonCanadaCaribbeanCentral AmericaChileChinaColombiaCongoCosta RicaCroatiaCubaCzechoslovakiaDenmarkDominicaDominican RepublicEastern AfricaEastern AsiaEastern EuropeEcuadorEgyptEl SalvadorEnglandEritreaEthiopiaEuropeFijiFranceGermanyGhanaGreeceGrenadaGuatemalaGuyanaHaitiHondurasHong KongHungaryIndiaIndonesiaIranIraqIrelandIsraelItalyJamaicaJapanJordanKazakhstanKenyaKoreaKuwaitLaosLatin AmericaLatviaLebanonLiberiaLithuaniaMalaysiaMexicoMicronesiaMiddle AfricaMoldovaMoroccoNepalNetherlandsNicaraguaNigeriaNorth AmericaNorth MacedoniaNorthern AfricaNorthern EuropeNorwayOceaniaPakistanPanamaPeruPhilippinesPolandPortugalRomaniaRussiaSaudi ArabiaScotlandSenegalSerbiaSierra LeoneSingaporeSomaliaSouth AfricaSouth AmericaSouth Central AsiaSouth Eastern AsiaSouthern EuropeSpainSri LankaSt. Vincent and the GrenadinesSudanSwedenSwitzerlandSyriaTaiwanThailandTrinidad and TobagoTurkeyUgandaUkraineUruguayUzbekistanVenezuelaVietnamWest IndiesWestern AfricaWestern AsiaWestern EuropeYemenZaireZimbabweAzores
Cape Verdean
Race
Ancestry
AfghanAfricanAlaska NativeAlaskan AthabascanAlbanianAleutAlsatianAmericanApacheArabArapahoArgentineanArmenianAssyrian/Chaldean/SyriacAustralianAustrianBahamianBangladeshiBarbadianBasqueBelgianBelizeanBermudanBhutaneseBlackfeetBolivianBrazilianBritishBritish West IndianBulgarianCajunCambodianCanadianCape VerdeanCarpatho RusynCelticCentral AmericanCentral American IndianCherokeeCheyenneChickasawChileanChineseChippewaChoctawColombianColvilleComancheCosta RicanCreeCreekCroatianCrowCubanCypriotCzechCzechoslovakianDanishDelawareDominicanDutchDutch West IndianEastern EuropeanEcuadorianEgyptianEnglishEstonianEthiopianEuropeanFijianFilipinoFinnishFrenchFrench American IndianFrench CanadianGermanGerman RussianGhanaianGreekGuamanian/ChamorroGuatemalanGuyaneseHaitianHmongHonduranHopiHoumaHungarianIcelanderIndian (Asian)IndonesianInupiatIranianIraqiIrishIroquoisIsraeliItalianJamaicanJapaneseJordanianKenyanKiowaKoreanLaotianLatvianLebaneseLiberianLithuanianLumbeeLuxembourgerMacedonianMalaysianMalteseMarshalleseMenomineeMexicanMexican American IndianMongolianMoroccanNative HawaiianNavajoNepaleseNew ZealanderNicaraguanNigerianNorthern EuropeanNorwegianOkinawanOsageOttawaPaiutePakistaniPalestinianPanamanianParaguayanPennsylvania GermanPeruvianPimaPolishPortuguesePotawatomiPuebloPuerto RicanPuget Sound SalishRomanianRussianSalvadoranSamoanScandinavianScotch-IrishScottishSeminoleSenegaleseSerbianShoshoneSierra LeoneanSiouxSlavicSlovakSloveneSomaliSouth AfricanSouth AmericanSouth American IndianSoviet UnionSpaniardSpanishSpanish AmericanSpanish American IndianSri LankanSubsaharan AfricanSudaneseSwedishSwissSyrianTaiwaneseThaiTlingit-HaidaTohono O'OdhamTonganTrinidadian and TobagonianTsimshianTurkishU.S. Virgin IslanderUgandanUkrainianUruguayanUteVenezuelanVietnameseWelshWest IndianYakamaYaquiYugoslavianYumanYup'ikZimbabwean
Immigration
NonimmigrantsImmigrantsAfghanistanAfricaAlbaniaArgentinaArmeniaAsiaAustraliaAustriaBahamasBangladeshBarbadosBelarusBelgiumBelizeBoliviaBosnia and HerzegovinaBrazilBulgariaBurma/MyanmarCabo VerdeCambodiaCameroonCanadaCaribbeanCentral AmericaChileChinaColombiaCongoCosta RicaCroatiaCubaCzechoslovakiaDenmarkDominicaDominican RepublicEastern AfricaEastern AsiaEastern EuropeEcuadorEgyptEl SalvadorEnglandEritreaEthiopiaEuropeFijiFranceGermanyGhanaGreeceGrenadaGuatemalaGuyanaHaitiHondurasHong KongHungaryIndiaIndonesiaIranIraqIrelandIsraelItalyJamaicaJapanJordanKazakhstanKenyaKoreaKuwaitLaosLatin AmericaLatviaLebanonLiberiaLithuaniaMalaysiaMexicoMicronesiaMiddle AfricaMoldovaMoroccoNepalNetherlandsNicaraguaNigeriaNorth AmericaNorth MacedoniaNorthern AfricaNorthern EuropeNorwayOceaniaPakistanPanamaPeruPhilippinesPolandPortugalRomaniaRussiaSaudi ArabiaScotlandSenegalSerbiaSierra LeoneSingaporeSomaliaSouth AfricaSouth AmericaSouth Central AsiaSouth Eastern AsiaSouthern EuropeSpainSri LankaSt. Vincent and the GrenadinesSudanSwedenSwitzerlandSyriaTaiwanThailandTrinidad and TobagoTurkeyUgandaUkraineUruguayUzbekistanVenezuelaVietnamWest IndiesWestern AfricaWestern AsiaWestern EuropeYemenZaireZimbabweAzores
Master's Degree
Income
Poverty
Unemployment
Labor Participation
Family Structure
Vehicle Availability
Education Level
Disability

Master's Degree Comparison

Burmese

Cape Verdeans

Exceptional
Tragic
19.7%
MASTER'S DEGREE
100.0/ 100
METRIC RATING
32nd/ 347
METRIC RANK
12.1%
MASTER'S DEGREE
0.3/ 100
METRIC RATING
274th/ 347
METRIC RANK

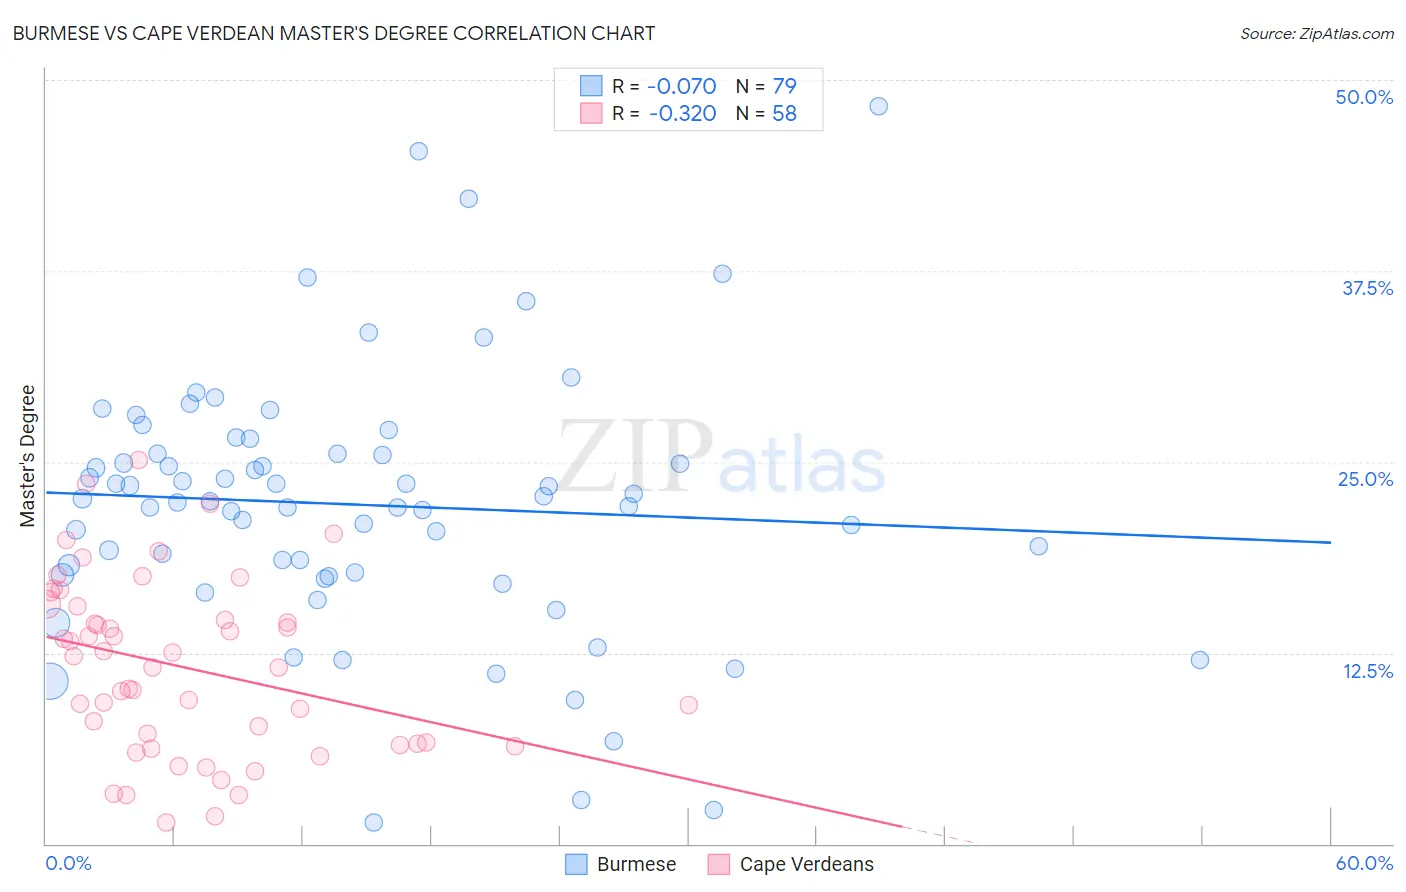
Burmese vs Cape Verdean Master's Degree Correlation Chart

The statistical analysis conducted on geographies consisting of 465,142,202 people shows a slight negative correlation between the proportion of Burmese and percentage of population with at least master's degree education in the United States with a correlation coefficient (R) of -0.070 and weighted average of 19.7%. Similarly, the statistical analysis conducted on geographies consisting of 107,570,267 people shows a mild negative correlation between the proportion of Cape Verdeans and percentage of population with at least master's degree education in the United States with a correlation coefficient (R) of -0.320 and weighted average of 12.1%, a difference of 63.1%.
Burmese vs Cape Verdean Master's Degree

Master's Degree Correlation Summary

MeasurementBurmeseCape Verdean
Minimum1.4%1.4%
Maximum48.2%25.1%
Range46.8%23.8%
Mean22.2%11.6%
Median22.5%11.9%
Interquartile 25% (IQ1)17.6%6.6%
Interquartile 75% (IQ3)25.5%15.6%
Interquartile Range (IQR)8.0%9.0%
Standard Deviation (Sample)8.6%5.7%
Standard Deviation (Population)8.5%5.7%

Similar Demographics by Master's Degree

Demographics Similar to Burmese by Master's Degree

In terms of master's degree, the demographic groups most similar to Burmese are Immigrants from Korea (19.7%, a difference of 0.070%), Immigrants from Turkey (19.7%, a difference of 0.080%), Latvian (19.8%, a difference of 0.58%), Russian (19.5%, a difference of 0.79%), and Immigrants from Denmark (19.5%, a difference of 0.81%).
DemographicsRating | RankMaster's Degree
Immigrants | Japan
100.0
/100
|
#25
Exceptional
20.0%
Cambodians
100.0
/100
|
#26
Exceptional
20.0%
Immigrants | Sri Lanka
100.0
/100
|
#27
Exceptional
19.9%
Turks
100.0
/100
|
#28
Exceptional
19.9%
Latvians
100.0
/100
|
#29
Exceptional
19.8%
Immigrants | Turkey
100.0
/100
|
#30
Exceptional
19.7%
Immigrants | Korea
100.0
/100
|
#31
Exceptional
19.7%
Burmese
100.0
/100
|
#32
Exceptional
19.7%
Russians
100.0
/100
|
#33
Exceptional
19.5%
Immigrants | Denmark
100.0
/100
|
#34
Exceptional
19.5%
Immigrants | Northern Europe
100.0
/100
|
#35
Exceptional
19.5%
Immigrants | Russia
100.0
/100
|
#36
Exceptional
19.4%
Mongolians
100.0
/100
|
#37
Exceptional
19.4%
Bolivians
100.0
/100
|
#38
Exceptional
19.3%
Immigrants | Spain
100.0
/100
|
#39
Exceptional
19.1%

Demographics Similar to Cape Verdeans by Master's Degree

In terms of master's degree, the demographic groups most similar to Cape Verdeans are Cuban (12.1%, a difference of 0.020%), Black/African American (12.1%, a difference of 0.070%), Immigrants from Caribbean (12.1%, a difference of 0.080%), Potawatomi (12.1%, a difference of 0.080%), and Blackfeet (12.1%, a difference of 0.090%).
DemographicsRating | RankMaster's Degree
Americans
0.4
/100
|
#267
Tragic
12.3%
Native Hawaiians
0.4
/100
|
#268
Tragic
12.3%
Central Americans
0.3
/100
|
#269
Tragic
12.2%
Salvadorans
0.3
/100
|
#270
Tragic
12.2%
Haitians
0.3
/100
|
#271
Tragic
12.1%
Comanche
0.3
/100
|
#272
Tragic
12.1%
Blackfeet
0.3
/100
|
#273
Tragic
12.1%
Cape Verdeans
0.3
/100
|
#274
Tragic
12.1%
Cubans
0.3
/100
|
#275
Tragic
12.1%
Blacks/African Americans
0.3
/100
|
#276
Tragic
12.1%
Immigrants | Caribbean
0.3
/100
|
#277
Tragic
12.1%
Potawatomi
0.3
/100
|
#278
Tragic
12.1%
Immigrants | Belize
0.2
/100
|
#279
Tragic
12.1%
Immigrants | Dominican Republic
0.2
/100
|
#280
Tragic
12.1%
Malaysians
0.2
/100
|
#281
Tragic
12.0%