Bulgarian vs Immigrants from Panama 2nd Grade
COMPARE
Bulgarian
Immigrants from Panama
2nd Grade
2nd Grade Comparison
Bulgarians
Immigrants from Panama
98.3%
2ND GRADE
99.8/ 100
METRIC RATING
58th/ 347
METRIC RANK
97.6%
2ND GRADE
5.1/ 100
METRIC RATING
219th/ 347
METRIC RANK
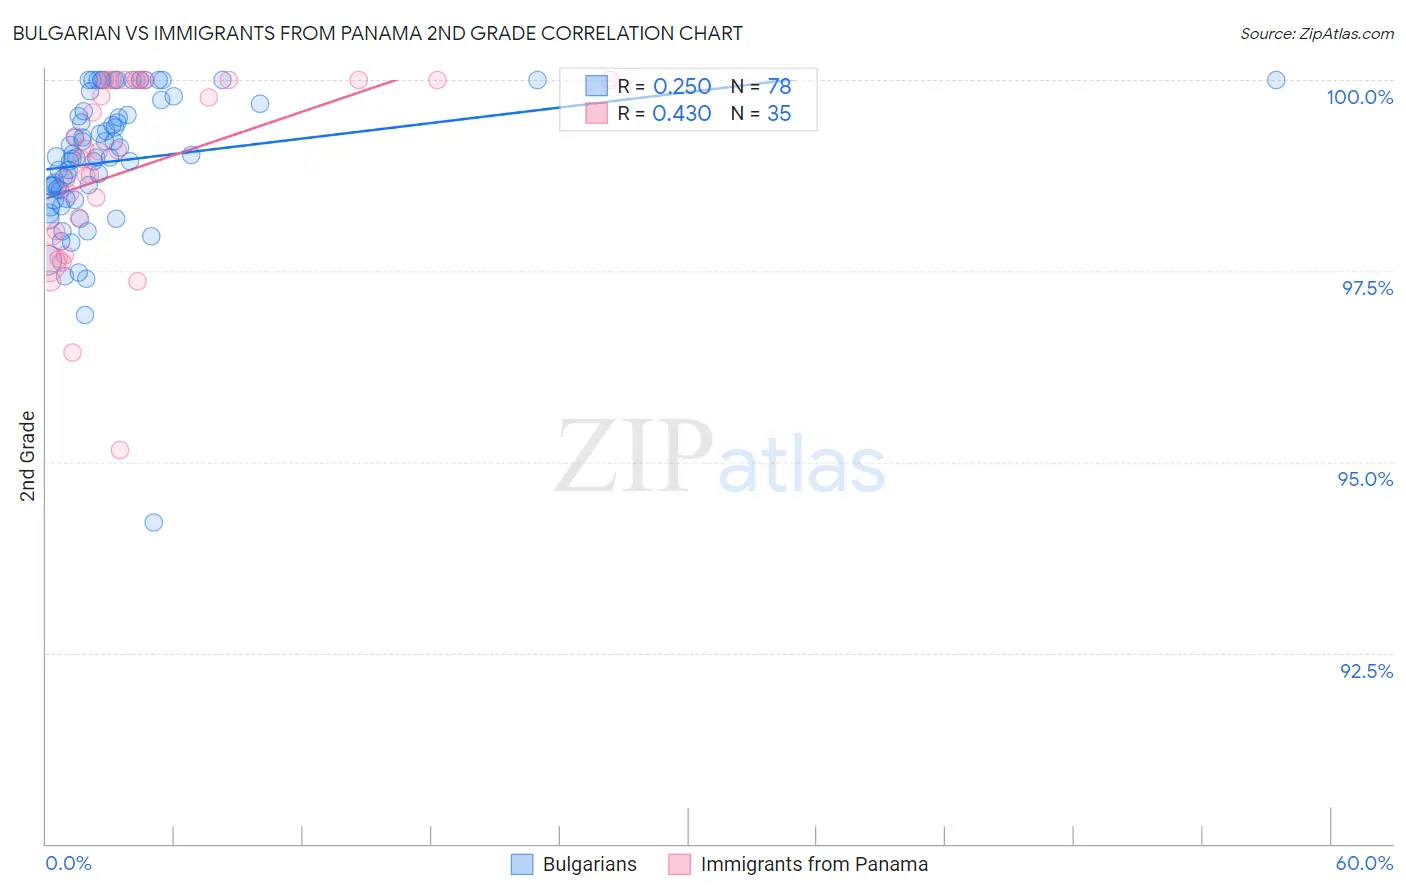
Bulgarian vs Immigrants from Panama 2nd Grade Correlation Chart
The statistical analysis conducted on geographies consisting of 205,633,223 people shows a weak positive correlation between the proportion of Bulgarians and percentage of population with at least 2nd grade education in the United States with a correlation coefficient (R) of 0.250 and weighted average of 98.3%. Similarly, the statistical analysis conducted on geographies consisting of 221,182,871 people shows a moderate positive correlation between the proportion of Immigrants from Panama and percentage of population with at least 2nd grade education in the United States with a correlation coefficient (R) of 0.430 and weighted average of 97.6%, a difference of 0.71%.
2nd Grade Correlation Summary
| Measurement | Bulgarian | Immigrants from Panama |
| Minimum | 94.2% | 95.1% |
| Maximum | 100.0% | 100.0% |
| Range | 5.8% | 4.9% |
| Mean | 98.9% | 98.8% |
| Median | 99.0% | 99.1% |
| Interquartile 25% (IQ1) | 98.4% | 98.0% |
| Interquartile 75% (IQ3) | 99.6% | 100.0% |
| Interquartile Range (IQR) | 1.2% | 2.0% |
| Standard Deviation (Sample) | 0.93% | 1.2% |
| Standard Deviation (Population) | 0.93% | 1.2% |
Similar Demographics by 2nd Grade
Demographics Similar to Bulgarians by 2nd Grade
In terms of 2nd grade, the demographic groups most similar to Bulgarians are American (98.3%, a difference of 0.0%), Austrian (98.3%, a difference of 0.0%), Pueblo (98.3%, a difference of 0.010%), Kiowa (98.3%, a difference of 0.010%), and Immigrants from Scotland (98.3%, a difference of 0.010%).
| Demographics | Rating | Rank | 2nd Grade |
| Estonians | 99.8 /100 | #51 | Exceptional 98.4% |
| Australians | 99.8 /100 | #52 | Exceptional 98.4% |
| Pueblo | 99.8 /100 | #53 | Exceptional 98.3% |
| Kiowa | 99.8 /100 | #54 | Exceptional 98.3% |
| Immigrants | Scotland | 99.8 /100 | #55 | Exceptional 98.3% |
| Americans | 99.8 /100 | #56 | Exceptional 98.3% |
| Austrians | 99.8 /100 | #57 | Exceptional 98.3% |
| Bulgarians | 99.8 /100 | #58 | Exceptional 98.3% |
| Slavs | 99.8 /100 | #59 | Exceptional 98.3% |
| Creek | 99.8 /100 | #60 | Exceptional 98.3% |
| Immigrants | Canada | 99.8 /100 | #61 | Exceptional 98.3% |
| Greeks | 99.8 /100 | #62 | Exceptional 98.3% |
| Maltese | 99.7 /100 | #63 | Exceptional 98.3% |
| Immigrants | North America | 99.7 /100 | #64 | Exceptional 98.3% |
| New Zealanders | 99.7 /100 | #65 | Exceptional 98.3% |
Demographics Similar to Immigrants from Panama by 2nd Grade
In terms of 2nd grade, the demographic groups most similar to Immigrants from Panama are Immigrants from Morocco (97.6%, a difference of 0.0%), Sudanese (97.7%, a difference of 0.010%), Iraqi (97.6%, a difference of 0.010%), Immigrants from Sudan (97.6%, a difference of 0.010%), and Bahamian (97.7%, a difference of 0.020%).
| Demographics | Rating | Rank | 2nd Grade |
| Immigrants | Bahamas | 8.4 /100 | #212 | Tragic 97.7% |
| Moroccans | 8.2 /100 | #213 | Tragic 97.7% |
| Samoans | 7.1 /100 | #214 | Tragic 97.7% |
| Bahamians | 6.8 /100 | #215 | Tragic 97.7% |
| South American Indians | 6.7 /100 | #216 | Tragic 97.7% |
| Uruguayans | 6.2 /100 | #217 | Tragic 97.7% |
| Sudanese | 5.7 /100 | #218 | Tragic 97.7% |
| Immigrants | Panama | 5.1 /100 | #219 | Tragic 97.6% |
| Immigrants | Morocco | 5.0 /100 | #220 | Tragic 97.6% |
| Iraqis | 4.6 /100 | #221 | Tragic 97.6% |
| Immigrants | Sudan | 4.5 /100 | #222 | Tragic 97.6% |
| Sierra Leoneans | 4.3 /100 | #223 | Tragic 97.6% |
| Immigrants | Zaire | 4.3 /100 | #224 | Tragic 97.6% |
| Tongans | 4.3 /100 | #225 | Tragic 97.6% |
| Immigrants | Syria | 4.0 /100 | #226 | Tragic 97.6% |