Brazilian vs Russian Professional Degree

COMPARE

Brazilian
Race
Ancestry
AfghanAfricanAlaska NativeAlaskan AthabascanAlbanianAleutAlsatianAmericanApacheArabArapahoArgentineanArmenianAssyrian/Chaldean/SyriacAustralianAustrianBahamianBangladeshiBarbadianBasqueBelgianBelizeanBermudanBhutaneseBlackfeetBolivianBrazilianBritishBritish West IndianBulgarianBurmeseCajunCambodianCanadianCape VerdeanCarpatho RusynCelticCentral AmericanCentral American IndianCherokeeCheyenneChickasawChileanChineseChippewaChoctawColombianColvilleComancheCosta RicanCreeCreekCroatianCrowCubanCypriotCzechCzechoslovakianDanishDelawareDominicanDutchDutch West IndianEastern EuropeanEcuadorianEgyptianEnglishEstonianEthiopianEuropeanFijianFilipinoFinnishFrenchFrench American IndianFrench CanadianGermanGerman RussianGhanaianGreekGuamanian/ChamorroGuatemalanGuyaneseHaitianHmongHonduranHopiHoumaHungarianIcelanderIndian (Asian)IndonesianInupiatIranianIraqiIrishIroquoisIsraeliItalianJamaicanJapaneseJordanianKenyanKiowaKoreanLaotianLatvianLebaneseLiberianLithuanianLumbeeLuxembourgerMacedonianMalaysianMalteseMarshalleseMenomineeMexicanMexican American IndianMongolianMoroccanNative HawaiianNavajoNepaleseNew ZealanderNicaraguanNigerianNorthern EuropeanNorwegianOkinawanOsageOttawaPaiutePakistaniPalestinianPanamanianParaguayanPennsylvania GermanPeruvianPimaPolishPortuguesePotawatomiPuebloPuerto RicanPuget Sound SalishRomanianSalvadoranSamoanScandinavianScotch-IrishScottishSeminoleSenegaleseSerbianShoshoneSierra LeoneanSiouxSlavicSlovakSloveneSomaliSouth AfricanSouth AmericanSouth American IndianSoviet UnionSpaniardSpanishSpanish AmericanSpanish American IndianSri LankanSubsaharan AfricanSudaneseSwedishSwissSyrianTaiwaneseThaiTlingit-HaidaTohono O'OdhamTonganTrinidadian and TobagonianTsimshianTurkishU.S. Virgin IslanderUgandanUkrainianUruguayanUteVenezuelanVietnameseWelshWest IndianYakamaYaquiYugoslavianYumanYup'ikZimbabwean
Immigration
NonimmigrantsImmigrantsAfghanistanAfricaAlbaniaArgentinaArmeniaAsiaAustraliaAustriaBahamasBangladeshBarbadosBelarusBelgiumBelizeBoliviaBosnia and HerzegovinaBrazilBulgariaBurma/MyanmarCabo VerdeCambodiaCameroonCanadaCaribbeanCentral AmericaChileChinaColombiaCongoCosta RicaCroatiaCubaCzechoslovakiaDenmarkDominicaDominican RepublicEastern AfricaEastern AsiaEastern EuropeEcuadorEgyptEl SalvadorEnglandEritreaEthiopiaEuropeFijiFranceGermanyGhanaGreeceGrenadaGuatemalaGuyanaHaitiHondurasHong KongHungaryIndiaIndonesiaIranIraqIrelandIsraelItalyJamaicaJapanJordanKazakhstanKenyaKoreaKuwaitLaosLatin AmericaLatviaLebanonLiberiaLithuaniaMalaysiaMexicoMicronesiaMiddle AfricaMoldovaMoroccoNepalNetherlandsNicaraguaNigeriaNorth AmericaNorth MacedoniaNorthern AfricaNorthern EuropeNorwayOceaniaPakistanPanamaPeruPhilippinesPolandPortugalRomaniaRussiaSaudi ArabiaScotlandSenegalSerbiaSierra LeoneSingaporeSomaliaSouth AfricaSouth AmericaSouth Central AsiaSouth Eastern AsiaSouthern EuropeSpainSri LankaSt. Vincent and the GrenadinesSudanSwedenSwitzerlandSyriaTaiwanThailandTrinidad and TobagoTurkeyUgandaUkraineUruguayUzbekistanVenezuelaVietnamWest IndiesWestern AfricaWestern AsiaWestern EuropeYemenZaireZimbabweAzores
Russian
Race
Ancestry
AfghanAfricanAlaska NativeAlaskan AthabascanAlbanianAleutAlsatianAmericanApacheArabArapahoArgentineanArmenianAssyrian/Chaldean/SyriacAustralianAustrianBahamianBangladeshiBarbadianBasqueBelgianBelizeanBermudanBhutaneseBlackfeetBolivianBritishBritish West IndianBulgarianBurmeseCajunCambodianCanadianCape VerdeanCarpatho RusynCelticCentral AmericanCentral American IndianCherokeeCheyenneChickasawChileanChineseChippewaChoctawColombianColvilleComancheCosta RicanCreeCreekCroatianCrowCubanCypriotCzechCzechoslovakianDanishDelawareDominicanDutchDutch West IndianEastern EuropeanEcuadorianEgyptianEnglishEstonianEthiopianEuropeanFijianFilipinoFinnishFrenchFrench American IndianFrench CanadianGermanGerman RussianGhanaianGreekGuamanian/ChamorroGuatemalanGuyaneseHaitianHmongHonduranHopiHoumaHungarianIcelanderIndian (Asian)IndonesianInupiatIranianIraqiIrishIroquoisIsraeliItalianJamaicanJapaneseJordanianKenyanKiowaKoreanLaotianLatvianLebaneseLiberianLithuanianLumbeeLuxembourgerMacedonianMalaysianMalteseMarshalleseMenomineeMexicanMexican American IndianMongolianMoroccanNative HawaiianNavajoNepaleseNew ZealanderNicaraguanNigerianNorthern EuropeanNorwegianOkinawanOsageOttawaPaiutePakistaniPalestinianPanamanianParaguayanPennsylvania GermanPeruvianPimaPolishPortuguesePotawatomiPuebloPuerto RicanPuget Sound SalishRomanianRussianSalvadoranSamoanScandinavianScotch-IrishScottishSeminoleSenegaleseSerbianShoshoneSierra LeoneanSiouxSlavicSlovakSloveneSomaliSouth AfricanSouth AmericanSouth American IndianSoviet UnionSpaniardSpanishSpanish AmericanSpanish American IndianSri LankanSubsaharan AfricanSudaneseSwedishSwissSyrianTaiwaneseThaiTlingit-HaidaTohono O'OdhamTonganTrinidadian and TobagonianTsimshianTurkishU.S. Virgin IslanderUgandanUkrainianUruguayanUteVenezuelanVietnameseWelshWest IndianYakamaYaquiYugoslavianYumanYup'ikZimbabwean
Immigration
NonimmigrantsImmigrantsAfghanistanAfricaAlbaniaArgentinaArmeniaAsiaAustraliaAustriaBahamasBangladeshBarbadosBelarusBelgiumBelizeBoliviaBosnia and HerzegovinaBrazilBulgariaBurma/MyanmarCabo VerdeCambodiaCameroonCanadaCaribbeanCentral AmericaChileChinaColombiaCongoCosta RicaCroatiaCubaCzechoslovakiaDenmarkDominicaDominican RepublicEastern AfricaEastern AsiaEastern EuropeEcuadorEgyptEl SalvadorEnglandEritreaEthiopiaEuropeFijiFranceGermanyGhanaGreeceGrenadaGuatemalaGuyanaHaitiHondurasHong KongHungaryIndiaIndonesiaIranIraqIrelandIsraelItalyJamaicaJapanJordanKazakhstanKenyaKoreaKuwaitLaosLatin AmericaLatviaLebanonLiberiaLithuaniaMalaysiaMexicoMicronesiaMiddle AfricaMoldovaMoroccoNepalNetherlandsNicaraguaNigeriaNorth AmericaNorth MacedoniaNorthern AfricaNorthern EuropeNorwayOceaniaPakistanPanamaPeruPhilippinesPolandPortugalRomaniaRussiaSaudi ArabiaScotlandSenegalSerbiaSierra LeoneSingaporeSomaliaSouth AfricaSouth AmericaSouth Central AsiaSouth Eastern AsiaSouthern EuropeSpainSri LankaSt. Vincent and the GrenadinesSudanSwedenSwitzerlandSyriaTaiwanThailandTrinidad and TobagoTurkeyUgandaUkraineUruguayUzbekistanVenezuelaVietnamWest IndiesWestern AfricaWestern AsiaWestern EuropeYemenZaireZimbabweAzores
Professional Degree
Income
Poverty
Unemployment
Labor Participation
Family Structure
Vehicle Availability
Education Level
Disability

Professional Degree Comparison

Brazilians

Russians

Exceptional
Exceptional
5.0%
PROFESSIONAL DEGREE
97.4/ 100
METRIC RATING
111th/ 347
METRIC RANK
6.3%
PROFESSIONAL DEGREE
100.0/ 100
METRIC RATING
23rd/ 347
METRIC RANK

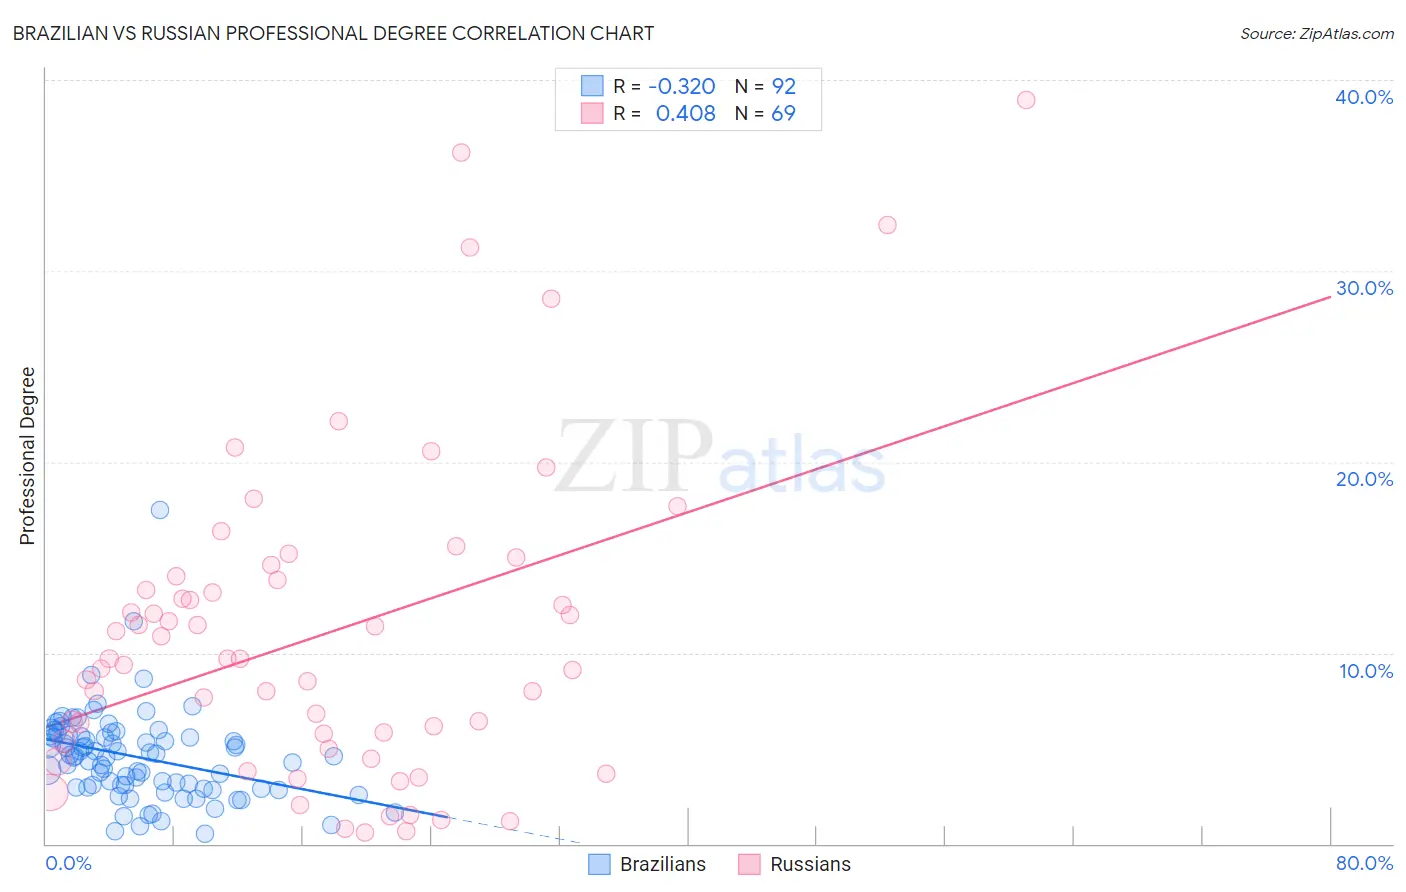
Brazilian vs Russian Professional Degree Correlation Chart

The statistical analysis conducted on geographies consisting of 323,483,336 people shows a mild negative correlation between the proportion of Brazilians and percentage of population with at least professional degree education in the United States with a correlation coefficient (R) of -0.320 and weighted average of 5.0%. Similarly, the statistical analysis conducted on geographies consisting of 509,341,332 people shows a moderate positive correlation between the proportion of Russians and percentage of population with at least professional degree education in the United States with a correlation coefficient (R) of 0.408 and weighted average of 6.3%, a difference of 26.9%.
Brazilian vs Russian Professional Degree

Professional Degree Correlation Summary

MeasurementBrazilianRussian
Minimum0.54%0.56%
Maximum17.5%39.0%
Range17.0%38.4%
Mean4.5%11.0%
Median4.6%9.7%
Interquartile 25% (IQ1)3.0%5.2%
Interquartile 75% (IQ3)5.7%13.9%
Interquartile Range (IQR)2.7%8.7%
Standard Deviation (Sample)2.4%8.3%
Standard Deviation (Population)2.4%8.3%

Similar Demographics by Professional Degree

Demographics Similar to Brazilians by Professional Degree

In terms of professional degree, the demographic groups most similar to Brazilians are Taiwanese (5.0%, a difference of 0.22%), Immigrants from Pakistan (5.0%, a difference of 0.24%), Immigrants from Morocco (5.0%, a difference of 0.69%), Lebanese (5.0%, a difference of 0.74%), and Moroccan (5.0%, a difference of 0.79%).
DemographicsRating | RankProfessional Degree
Arabs
98.2
/100
|
#104
Exceptional
5.0%
Immigrants | Uganda
98.2
/100
|
#105
Exceptional
5.0%
Immigrants | Ukraine
98.2
/100
|
#106
Exceptional
5.0%
Maltese
98.1
/100
|
#107
Exceptional
5.0%
Immigrants | Southern Europe
98.1
/100
|
#108
Exceptional
5.0%
British
98.0
/100
|
#109
Exceptional
5.0%
Lebanese
98.0
/100
|
#110
Exceptional
5.0%
Brazilians
97.4
/100
|
#111
Exceptional
5.0%
Taiwanese
97.3
/100
|
#112
Exceptional
5.0%
Immigrants | Pakistan
97.2
/100
|
#113
Exceptional
5.0%
Immigrants | Morocco
96.8
/100
|
#114
Exceptional
5.0%
Moroccans
96.8
/100
|
#115
Exceptional
5.0%
Venezuelans
96.3
/100
|
#116
Exceptional
4.9%
Immigrants | Syria
96.0
/100
|
#117
Exceptional
4.9%
Croatians
96.0
/100
|
#118
Exceptional
4.9%

Demographics Similar to Russians by Professional Degree

In terms of professional degree, the demographic groups most similar to Russians are Immigrants from Spain (6.3%, a difference of 0.040%), Immigrants from Japan (6.4%, a difference of 0.48%), Immigrants from Ireland (6.3%, a difference of 0.53%), Immigrants from Hong Kong (6.4%, a difference of 1.2%), and Latvian (6.2%, a difference of 1.4%).
DemographicsRating | RankProfessional Degree
Immigrants | Sweden
100.0
/100
|
#16
Exceptional
6.7%
Immigrants | Eastern Asia
100.0
/100
|
#17
Exceptional
6.6%
Soviet Union
100.0
/100
|
#18
Exceptional
6.6%
Indians (Asian)
100.0
/100
|
#19
Exceptional
6.5%
Immigrants | Denmark
100.0
/100
|
#20
Exceptional
6.4%
Immigrants | Hong Kong
100.0
/100
|
#21
Exceptional
6.4%
Immigrants | Japan
100.0
/100
|
#22
Exceptional
6.4%
Russians
100.0
/100
|
#23
Exceptional
6.3%
Immigrants | Spain
100.0
/100
|
#24
Exceptional
6.3%
Immigrants | Ireland
100.0
/100
|
#25
Exceptional
6.3%
Latvians
100.0
/100
|
#26
Exceptional
6.2%
Immigrants | Northern Europe
100.0
/100
|
#27
Exceptional
6.2%
Turks
100.0
/100
|
#28
Exceptional
6.2%
Immigrants | Sri Lanka
100.0
/100
|
#29
Exceptional
6.2%
Immigrants | Turkey
100.0
/100
|
#30
Exceptional
6.2%