Brazilian vs Immigrants from North Macedonia 8th Grade
COMPARE
Brazilian
Immigrants from North Macedonia
8th Grade
8th Grade Comparison
Brazilians
Immigrants from North Macedonia
95.6%
8TH GRADE
34.8/ 100
METRIC RATING
186th/ 347
METRIC RANK
96.3%
8TH GRADE
98.0/ 100
METRIC RATING
105th/ 347
METRIC RANK
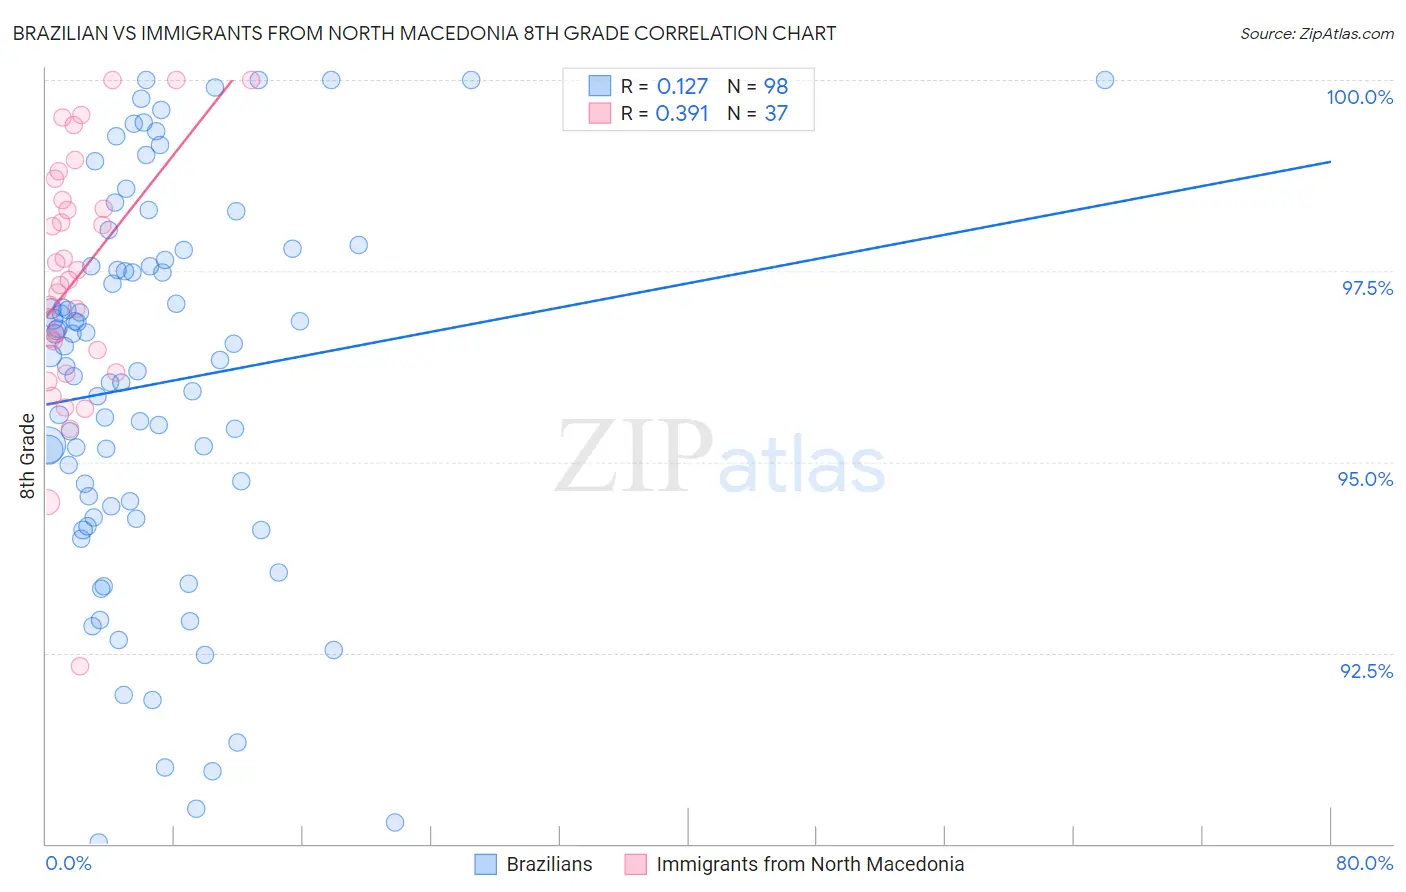
Brazilian vs Immigrants from North Macedonia 8th Grade Correlation Chart
The statistical analysis conducted on geographies consisting of 323,961,610 people shows a poor positive correlation between the proportion of Brazilians and percentage of population with at least 8th grade education in the United States with a correlation coefficient (R) of 0.127 and weighted average of 95.6%. Similarly, the statistical analysis conducted on geographies consisting of 74,252,242 people shows a mild positive correlation between the proportion of Immigrants from North Macedonia and percentage of population with at least 8th grade education in the United States with a correlation coefficient (R) of 0.391 and weighted average of 96.3%, a difference of 0.73%.
8th Grade Correlation Summary
| Measurement | Brazilian | Immigrants from North Macedonia |
| Minimum | 90.0% | 92.3% |
| Maximum | 100.0% | 100.0% |
| Range | 10.0% | 7.7% |
| Mean | 96.0% | 97.4% |
| Median | 96.4% | 97.4% |
| Interquartile 25% (IQ1) | 94.4% | 96.3% |
| Interquartile 75% (IQ3) | 97.6% | 98.6% |
| Interquartile Range (IQR) | 3.1% | 2.2% |
| Standard Deviation (Sample) | 2.5% | 1.7% |
| Standard Deviation (Population) | 2.5% | 1.6% |
Similar Demographics by 8th Grade
Demographics Similar to Brazilians by 8th Grade
In terms of 8th grade, the demographic groups most similar to Brazilians are Black/African American (95.6%, a difference of 0.0%), Immigrants from Iraq (95.6%, a difference of 0.010%), Immigrants from Uganda (95.6%, a difference of 0.010%), Sudanese (95.6%, a difference of 0.010%), and Immigrants from Egypt (95.7%, a difference of 0.020%).
| Demographics | Rating | Rank | 8th Grade |
| Immigrants | Brazil | 45.4 /100 | #179 | Average 95.7% |
| Iraqis | 40.5 /100 | #180 | Average 95.7% |
| Immigrants | Spain | 38.7 /100 | #181 | Fair 95.7% |
| Immigrants | Egypt | 37.9 /100 | #182 | Fair 95.7% |
| Immigrants | Iraq | 36.2 /100 | #183 | Fair 95.6% |
| Immigrants | Uganda | 36.0 /100 | #184 | Fair 95.6% |
| Blacks/African Americans | 34.8 /100 | #185 | Fair 95.6% |
| Brazilians | 34.8 /100 | #186 | Fair 95.6% |
| Sudanese | 33.0 /100 | #187 | Fair 95.6% |
| Liberians | 32.4 /100 | #188 | Fair 95.6% |
| Immigrants | Micronesia | 31.6 /100 | #189 | Fair 95.6% |
| Immigrants | Venezuela | 30.8 /100 | #190 | Fair 95.6% |
| Immigrants | Nepal | 30.2 /100 | #191 | Fair 95.6% |
| Pima | 28.6 /100 | #192 | Fair 95.6% |
| Panamanians | 28.4 /100 | #193 | Fair 95.6% |
Demographics Similar to Immigrants from North Macedonia by 8th Grade
In terms of 8th grade, the demographic groups most similar to Immigrants from North Macedonia are Immigrants from Saudi Arabia (96.3%, a difference of 0.0%), Kiowa (96.3%, a difference of 0.0%), Okinawan (96.3%, a difference of 0.0%), South African (96.4%, a difference of 0.010%), and Immigrants from Latvia (96.3%, a difference of 0.010%).
| Demographics | Rating | Rank | 8th Grade |
| Immigrants | Germany | 98.7 /100 | #98 | Exceptional 96.4% |
| Cree | 98.6 /100 | #99 | Exceptional 96.4% |
| Immigrants | Czechoslovakia | 98.6 /100 | #100 | Exceptional 96.4% |
| Bhutanese | 98.2 /100 | #101 | Exceptional 96.4% |
| South Africans | 98.2 /100 | #102 | Exceptional 96.4% |
| Immigrants | Saudi Arabia | 98.0 /100 | #103 | Exceptional 96.3% |
| Kiowa | 98.0 /100 | #104 | Exceptional 96.3% |
| Immigrants | North Macedonia | 98.0 /100 | #105 | Exceptional 96.3% |
| Okinawans | 98.0 /100 | #106 | Exceptional 96.3% |
| Immigrants | Latvia | 97.8 /100 | #107 | Exceptional 96.3% |
| Lebanese | 97.5 /100 | #108 | Exceptional 96.3% |
| Iroquois | 97.5 /100 | #109 | Exceptional 96.3% |
| Cajuns | 97.1 /100 | #110 | Exceptional 96.3% |
| Shoshone | 96.8 /100 | #111 | Exceptional 96.3% |
| Syrians | 96.7 /100 | #112 | Exceptional 96.3% |