Brazilian vs Immigrants from Ethiopia High School Diploma
COMPARE
Brazilian
Immigrants from Ethiopia
High School Diploma
High School Diploma Comparison
Brazilians
Immigrants from Ethiopia
89.3%
HIGH SCHOOL DIPLOMA
61.2/ 100
METRIC RATING
161st/ 347
METRIC RANK
88.9%
HIGH SCHOOL DIPLOMA
30.9/ 100
METRIC RATING
191st/ 347
METRIC RANK
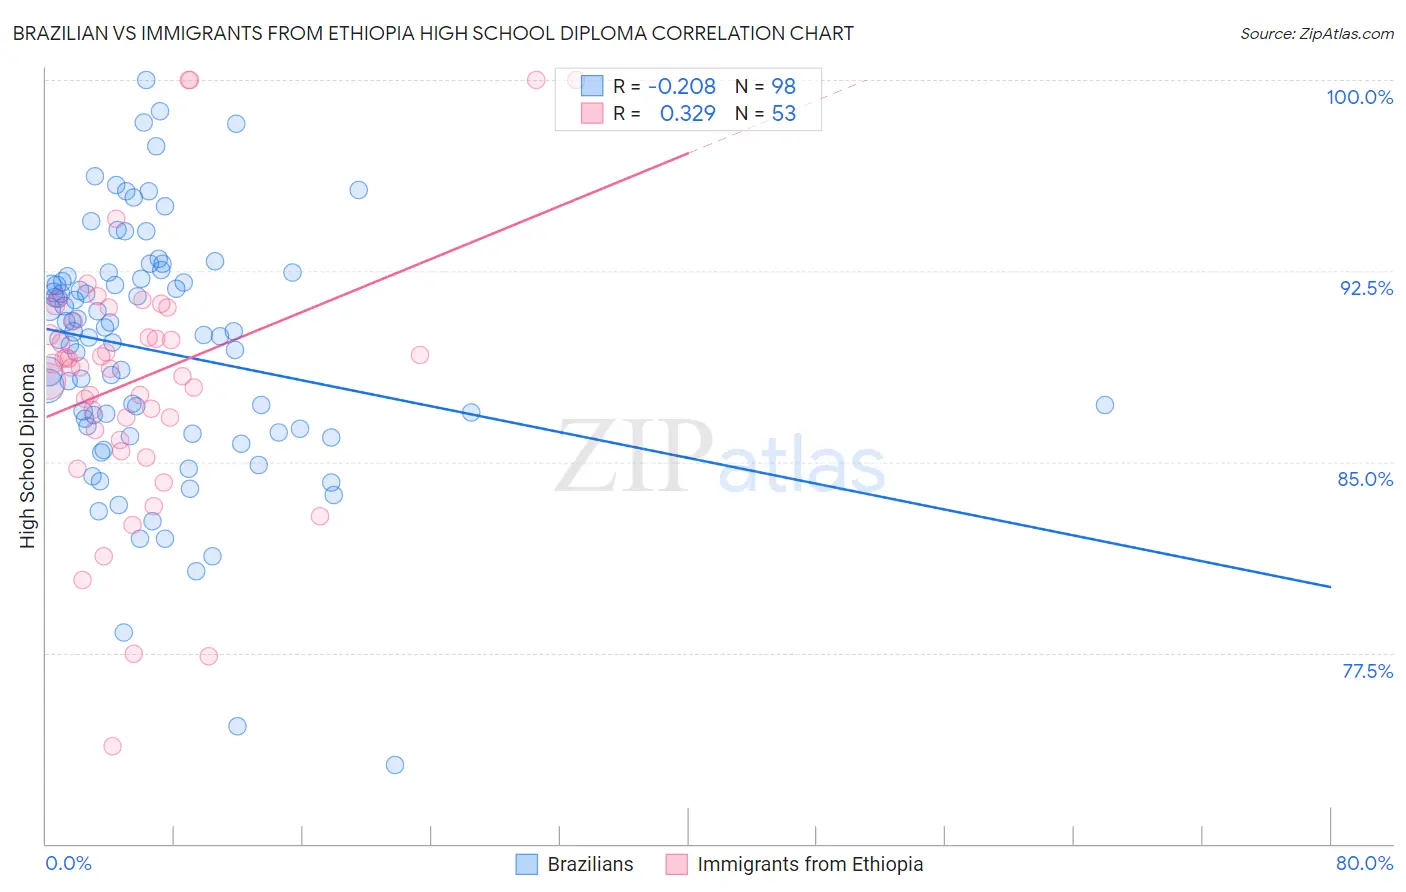
Brazilian vs Immigrants from Ethiopia High School Diploma Correlation Chart
The statistical analysis conducted on geographies consisting of 323,949,472 people shows a weak negative correlation between the proportion of Brazilians and percentage of population with at least high school diploma education in the United States with a correlation coefficient (R) of -0.208 and weighted average of 89.3%. Similarly, the statistical analysis conducted on geographies consisting of 211,528,629 people shows a mild positive correlation between the proportion of Immigrants from Ethiopia and percentage of population with at least high school diploma education in the United States with a correlation coefficient (R) of 0.329 and weighted average of 88.9%, a difference of 0.48%.
High School Diploma Correlation Summary
| Measurement | Brazilian | Immigrants from Ethiopia |
| Minimum | 73.1% | 73.8% |
| Maximum | 100.0% | 100.0% |
| Range | 26.9% | 26.2% |
| Mean | 89.4% | 88.3% |
| Median | 90.1% | 88.7% |
| Interquartile 25% (IQ1) | 86.3% | 86.1% |
| Interquartile 75% (IQ3) | 92.2% | 90.8% |
| Interquartile Range (IQR) | 5.9% | 4.7% |
| Standard Deviation (Sample) | 4.9% | 5.2% |
| Standard Deviation (Population) | 4.8% | 5.1% |
Similar Demographics by High School Diploma
Demographics Similar to Brazilians by High School Diploma
In terms of high school diploma, the demographic groups most similar to Brazilians are Bermudan (89.3%, a difference of 0.0%), Cree (89.3%, a difference of 0.0%), Immigrants from Nepal (89.3%, a difference of 0.0%), Immigrants from China (89.3%, a difference of 0.010%), and Laotian (89.3%, a difference of 0.010%).
| Demographics | Rating | Rank | High School Diploma |
| Alsatians | 66.8 /100 | #154 | Good 89.4% |
| Immigrants | Northern Africa | 66.4 /100 | #155 | Good 89.4% |
| Immigrants | Argentina | 65.5 /100 | #156 | Good 89.4% |
| Immigrants | Malaysia | 63.5 /100 | #157 | Good 89.3% |
| Immigrants | Pakistan | 62.5 /100 | #158 | Good 89.3% |
| Immigrants | China | 62.0 /100 | #159 | Good 89.3% |
| Laotians | 61.8 /100 | #160 | Good 89.3% |
| Brazilians | 61.2 /100 | #161 | Good 89.3% |
| Bermudans | 61.1 /100 | #162 | Good 89.3% |
| Cree | 61.1 /100 | #163 | Good 89.3% |
| Immigrants | Nepal | 61.1 /100 | #164 | Good 89.3% |
| Immigrants | Asia | 59.8 /100 | #165 | Average 89.3% |
| Immigrants | Albania | 59.4 /100 | #166 | Average 89.3% |
| Immigrants | Hong Kong | 58.6 /100 | #167 | Average 89.3% |
| Delaware | 55.8 /100 | #168 | Average 89.2% |
Demographics Similar to Immigrants from Ethiopia by High School Diploma
In terms of high school diploma, the demographic groups most similar to Immigrants from Ethiopia are Immigrants from Chile (88.9%, a difference of 0.020%), Moroccan (88.8%, a difference of 0.020%), Immigrants from Uganda (88.9%, a difference of 0.030%), Immigrants from Sudan (88.9%, a difference of 0.040%), and Immigrants from Oceania (88.8%, a difference of 0.070%).
| Demographics | Rating | Rank | High School Diploma |
| Immigrants | Syria | 39.2 /100 | #184 | Fair 89.0% |
| Ethiopians | 37.0 /100 | #185 | Fair 89.0% |
| Immigrants | Eastern Africa | 35.8 /100 | #186 | Fair 88.9% |
| Guamanians/Chamorros | 35.5 /100 | #187 | Fair 88.9% |
| Immigrants | Sudan | 33.4 /100 | #188 | Fair 88.9% |
| Immigrants | Uganda | 32.6 /100 | #189 | Fair 88.9% |
| Immigrants | Chile | 31.9 /100 | #190 | Fair 88.9% |
| Immigrants | Ethiopia | 30.9 /100 | #191 | Fair 88.9% |
| Moroccans | 29.5 /100 | #192 | Fair 88.8% |
| Immigrants | Oceania | 26.9 /100 | #193 | Fair 88.8% |
| Immigrants | Venezuela | 25.8 /100 | #194 | Fair 88.8% |
| Afghans | 23.9 /100 | #195 | Fair 88.8% |
| Immigrants | Southern Europe | 23.4 /100 | #196 | Fair 88.7% |
| French American Indians | 21.5 /100 | #197 | Fair 88.7% |
| Liberians | 18.8 /100 | #198 | Poor 88.7% |