Brazilian vs Argentinean Associate's Degree
COMPARE
Brazilian
Argentinean
Associate's Degree
Associate's Degree Comparison
Brazilians
Argentineans
48.7%
ASSOCIATE'S DEGREE
93.7/ 100
METRIC RATING
123rd/ 347
METRIC RANK
51.2%
ASSOCIATE'S DEGREE
99.6/ 100
METRIC RATING
67th/ 347
METRIC RANK
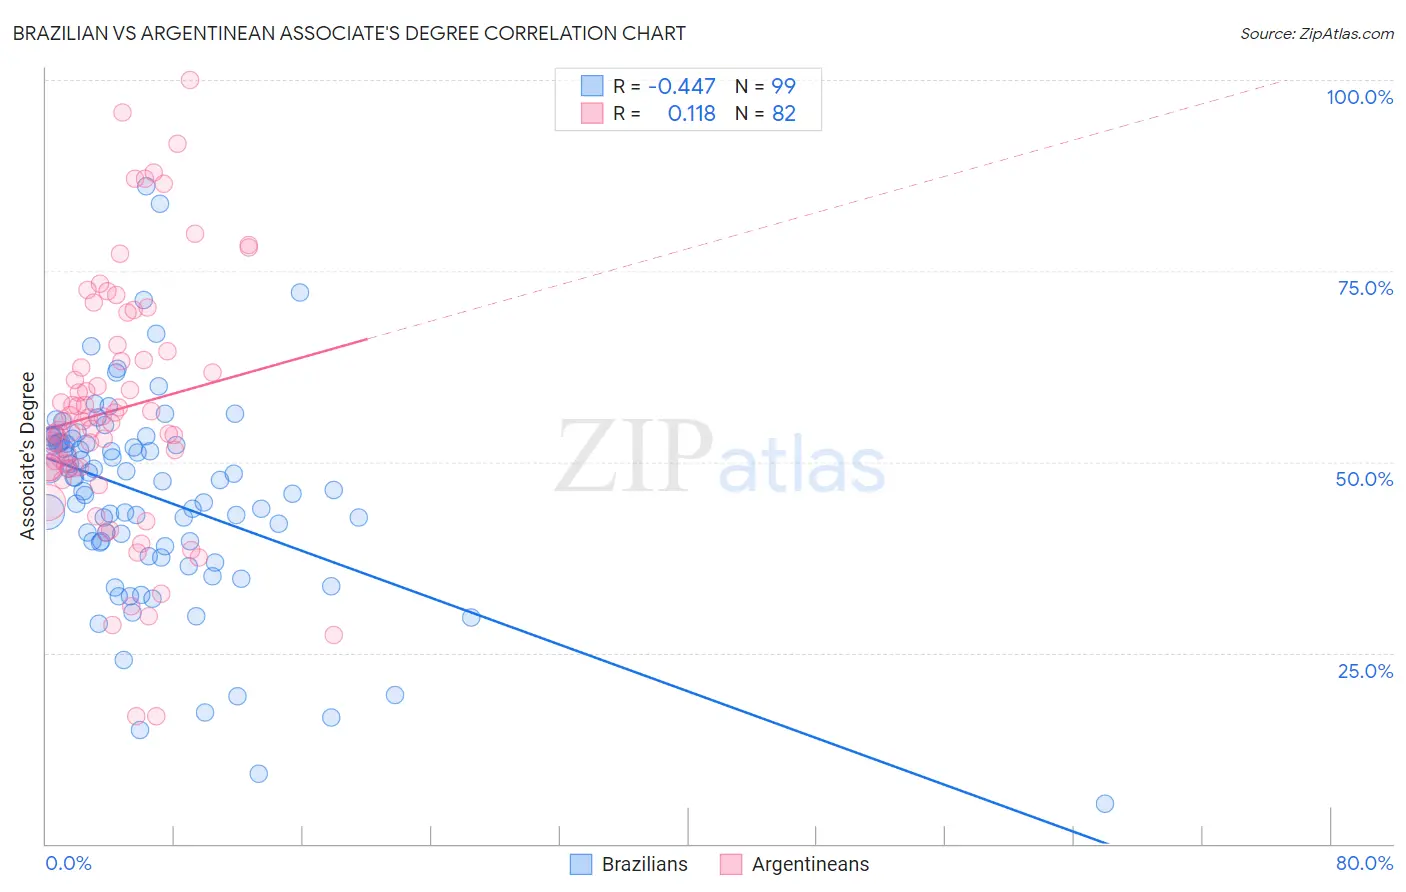
Brazilian vs Argentinean Associate's Degree Correlation Chart
The statistical analysis conducted on geographies consisting of 323,936,214 people shows a moderate negative correlation between the proportion of Brazilians and percentage of population with at least associate's degree education in the United States with a correlation coefficient (R) of -0.447 and weighted average of 48.7%. Similarly, the statistical analysis conducted on geographies consisting of 297,131,671 people shows a poor positive correlation between the proportion of Argentineans and percentage of population with at least associate's degree education in the United States with a correlation coefficient (R) of 0.118 and weighted average of 51.2%, a difference of 5.3%.
Associate's Degree Correlation Summary
| Measurement | Brazilian | Argentinean |
| Minimum | 5.3% | 16.7% |
| Maximum | 86.0% | 100.0% |
| Range | 80.8% | 83.3% |
| Mean | 45.3% | 56.8% |
| Median | 47.5% | 55.3% |
| Interquartile 25% (IQ1) | 38.9% | 49.2% |
| Interquartile 75% (IQ3) | 52.5% | 64.5% |
| Interquartile Range (IQR) | 13.6% | 15.4% |
| Standard Deviation (Sample) | 13.6% | 16.6% |
| Standard Deviation (Population) | 13.6% | 16.5% |
Similar Demographics by Associate's Degree
Demographics Similar to Brazilians by Associate's Degree
In terms of associate's degree, the demographic groups most similar to Brazilians are Italian (48.7%, a difference of 0.060%), Ugandan (48.7%, a difference of 0.070%), Alsatian (48.8%, a difference of 0.29%), Serbian (48.5%, a difference of 0.30%), and Chinese (48.5%, a difference of 0.31%).
| Demographics | Rating | Rank | Associate's Degree |
| British | 95.0 /100 | #116 | Exceptional 48.9% |
| Afghans | 94.8 /100 | #117 | Exceptional 48.9% |
| Albanians | 94.7 /100 | #118 | Exceptional 48.8% |
| Lebanese | 94.6 /100 | #119 | Exceptional 48.8% |
| Alsatians | 94.6 /100 | #120 | Exceptional 48.8% |
| Ugandans | 93.9 /100 | #121 | Exceptional 48.7% |
| Italians | 93.9 /100 | #122 | Exceptional 48.7% |
| Brazilians | 93.7 /100 | #123 | Exceptional 48.7% |
| Serbians | 92.6 /100 | #124 | Exceptional 48.5% |
| Chinese | 92.5 /100 | #125 | Exceptional 48.5% |
| Immigrants | Syria | 92.2 /100 | #126 | Exceptional 48.5% |
| Immigrants | Uganda | 92.1 /100 | #127 | Exceptional 48.5% |
| Immigrants | Eastern Africa | 91.6 /100 | #128 | Exceptional 48.4% |
| Swedes | 91.5 /100 | #129 | Exceptional 48.4% |
| Immigrants | Jordan | 91.2 /100 | #130 | Exceptional 48.4% |
Demographics Similar to Argentineans by Associate's Degree
In terms of associate's degree, the demographic groups most similar to Argentineans are Immigrants from Europe (51.3%, a difference of 0.13%), Zimbabwean (51.3%, a difference of 0.18%), Immigrants from Netherlands (51.4%, a difference of 0.22%), South African (51.4%, a difference of 0.29%), and Bhutanese (51.4%, a difference of 0.34%).
| Demographics | Rating | Rank | Associate's Degree |
| Immigrants | Bolivia | 99.7 /100 | #60 | Exceptional 51.5% |
| Immigrants | Kazakhstan | 99.7 /100 | #61 | Exceptional 51.4% |
| Bhutanese | 99.7 /100 | #62 | Exceptional 51.4% |
| South Africans | 99.7 /100 | #63 | Exceptional 51.4% |
| Immigrants | Netherlands | 99.7 /100 | #64 | Exceptional 51.4% |
| Zimbabweans | 99.7 /100 | #65 | Exceptional 51.3% |
| Immigrants | Europe | 99.7 /100 | #66 | Exceptional 51.3% |
| Argentineans | 99.6 /100 | #67 | Exceptional 51.2% |
| Immigrants | Indonesia | 99.5 /100 | #68 | Exceptional 51.0% |
| Egyptians | 99.5 /100 | #69 | Exceptional 50.9% |
| Immigrants | Argentina | 99.5 /100 | #70 | Exceptional 50.9% |
| Immigrants | Romania | 99.5 /100 | #71 | Exceptional 50.9% |
| Immigrants | Pakistan | 99.5 /100 | #72 | Exceptional 50.9% |
| Carpatho Rusyns | 99.3 /100 | #73 | Exceptional 50.6% |
| Lithuanians | 99.3 /100 | #74 | Exceptional 50.6% |