Bolivian vs Immigrants from Fiji Doctorate Degree
COMPARE
Bolivian
Immigrants from Fiji
Doctorate Degree
Doctorate Degree Comparison
Bolivians
Immigrants from Fiji
2.4%
DOCTORATE DEGREE
100.0/ 100
METRIC RATING
55th/ 347
METRIC RANK
1.6%
DOCTORATE DEGREE
1.6/ 100
METRIC RATING
250th/ 347
METRIC RANK
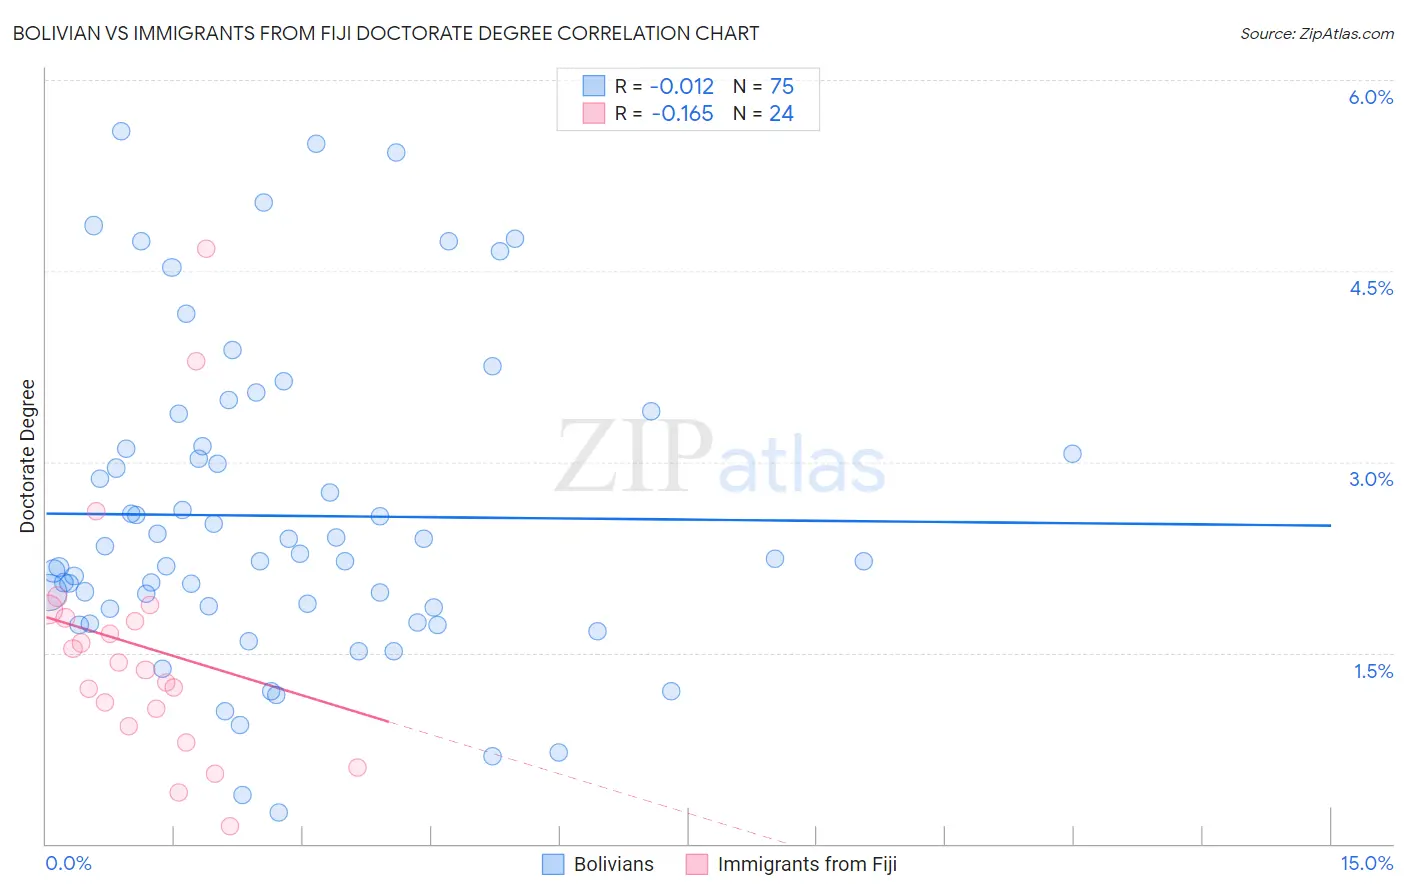
Bolivian vs Immigrants from Fiji Doctorate Degree Correlation Chart
The statistical analysis conducted on geographies consisting of 184,113,611 people shows no correlation between the proportion of Bolivians and percentage of population with at least doctorate degree education in the United States with a correlation coefficient (R) of -0.012 and weighted average of 2.4%. Similarly, the statistical analysis conducted on geographies consisting of 93,573,075 people shows a poor negative correlation between the proportion of Immigrants from Fiji and percentage of population with at least doctorate degree education in the United States with a correlation coefficient (R) of -0.165 and weighted average of 1.6%, a difference of 51.6%.
Doctorate Degree Correlation Summary
| Measurement | Bolivian | Immigrants from Fiji |
| Minimum | 0.25% | 0.14% |
| Maximum | 5.6% | 4.7% |
| Range | 5.3% | 4.5% |
| Mean | 2.6% | 1.5% |
| Median | 2.2% | 1.4% |
| Interquartile 25% (IQ1) | 1.8% | 0.99% |
| Interquartile 75% (IQ3) | 3.1% | 1.8% |
| Interquartile Range (IQR) | 1.3% | 0.82% |
| Standard Deviation (Sample) | 1.2% | 1.0% |
| Standard Deviation (Population) | 1.2% | 0.99% |
Similar Demographics by Doctorate Degree
Demographics Similar to Bolivians by Doctorate Degree
In terms of doctorate degree, the demographic groups most similar to Bolivians are Immigrants from Indonesia (2.4%, a difference of 0.080%), Immigrants from Czechoslovakia (2.4%, a difference of 0.090%), Immigrants from Ethiopia (2.4%, a difference of 0.53%), Ethiopian (2.3%, a difference of 0.65%), and Immigrants from Latvia (2.4%, a difference of 0.76%).
| Demographics | Rating | Rank | Doctorate Degree |
| Asians | 100.0 /100 | #48 | Exceptional 2.4% |
| Immigrants | Asia | 100.0 /100 | #49 | Exceptional 2.4% |
| Immigrants | Norway | 100.0 /100 | #50 | Exceptional 2.4% |
| Australians | 100.0 /100 | #51 | Exceptional 2.4% |
| Bulgarians | 100.0 /100 | #52 | Exceptional 2.4% |
| Immigrants | Latvia | 100.0 /100 | #53 | Exceptional 2.4% |
| Immigrants | Indonesia | 100.0 /100 | #54 | Exceptional 2.4% |
| Bolivians | 100.0 /100 | #55 | Exceptional 2.4% |
| Immigrants | Czechoslovakia | 100.0 /100 | #56 | Exceptional 2.4% |
| Immigrants | Ethiopia | 100.0 /100 | #57 | Exceptional 2.4% |
| Ethiopians | 99.9 /100 | #58 | Exceptional 2.3% |
| South Africans | 99.9 /100 | #59 | Exceptional 2.3% |
| Immigrants | Serbia | 99.9 /100 | #60 | Exceptional 2.3% |
| Bhutanese | 99.9 /100 | #61 | Exceptional 2.3% |
| Immigrants | Europe | 99.9 /100 | #62 | Exceptional 2.3% |
Demographics Similar to Immigrants from Fiji by Doctorate Degree
In terms of doctorate degree, the demographic groups most similar to Immigrants from Fiji are Potawatomi (1.6%, a difference of 0.030%), African (1.6%, a difference of 0.50%), Comanche (1.6%, a difference of 0.61%), Hmong (1.6%, a difference of 0.63%), and Delaware (1.6%, a difference of 0.73%).
| Demographics | Rating | Rank | Doctorate Degree |
| Native Hawaiians | 2.1 /100 | #243 | Tragic 1.6% |
| French American Indians | 2.0 /100 | #244 | Tragic 1.6% |
| Delaware | 1.9 /100 | #245 | Tragic 1.6% |
| Hmong | 1.8 /100 | #246 | Tragic 1.6% |
| Comanche | 1.8 /100 | #247 | Tragic 1.6% |
| Africans | 1.8 /100 | #248 | Tragic 1.6% |
| Potawatomi | 1.6 /100 | #249 | Tragic 1.6% |
| Immigrants | Fiji | 1.6 /100 | #250 | Tragic 1.6% |
| Apache | 1.3 /100 | #251 | Tragic 1.5% |
| Yuman | 1.1 /100 | #252 | Tragic 1.5% |
| Americans | 1.0 /100 | #253 | Tragic 1.5% |
| Immigrants | Cambodia | 1.0 /100 | #254 | Tragic 1.5% |
| Trinidadians and Tobagonians | 1.0 /100 | #255 | Tragic 1.5% |
| Central American Indians | 1.0 /100 | #256 | Tragic 1.5% |
| Chippewa | 0.9 /100 | #257 | Tragic 1.5% |