Black/African American vs Alaskan Athabascan 12th Grade, No Diploma
COMPARE
Black/African American
Alaskan Athabascan
12th Grade, No Diploma
12th Grade, No Diploma Comparison
Blacks/African Americans
Alaskan Athabascans
89.3%
12TH GRADE, NO DIPLOMA
0.1/ 100
METRIC RATING
271st/ 347
METRIC RANK
92.3%
12TH GRADE, NO DIPLOMA
98.1/ 100
METRIC RATING
102nd/ 347
METRIC RANK
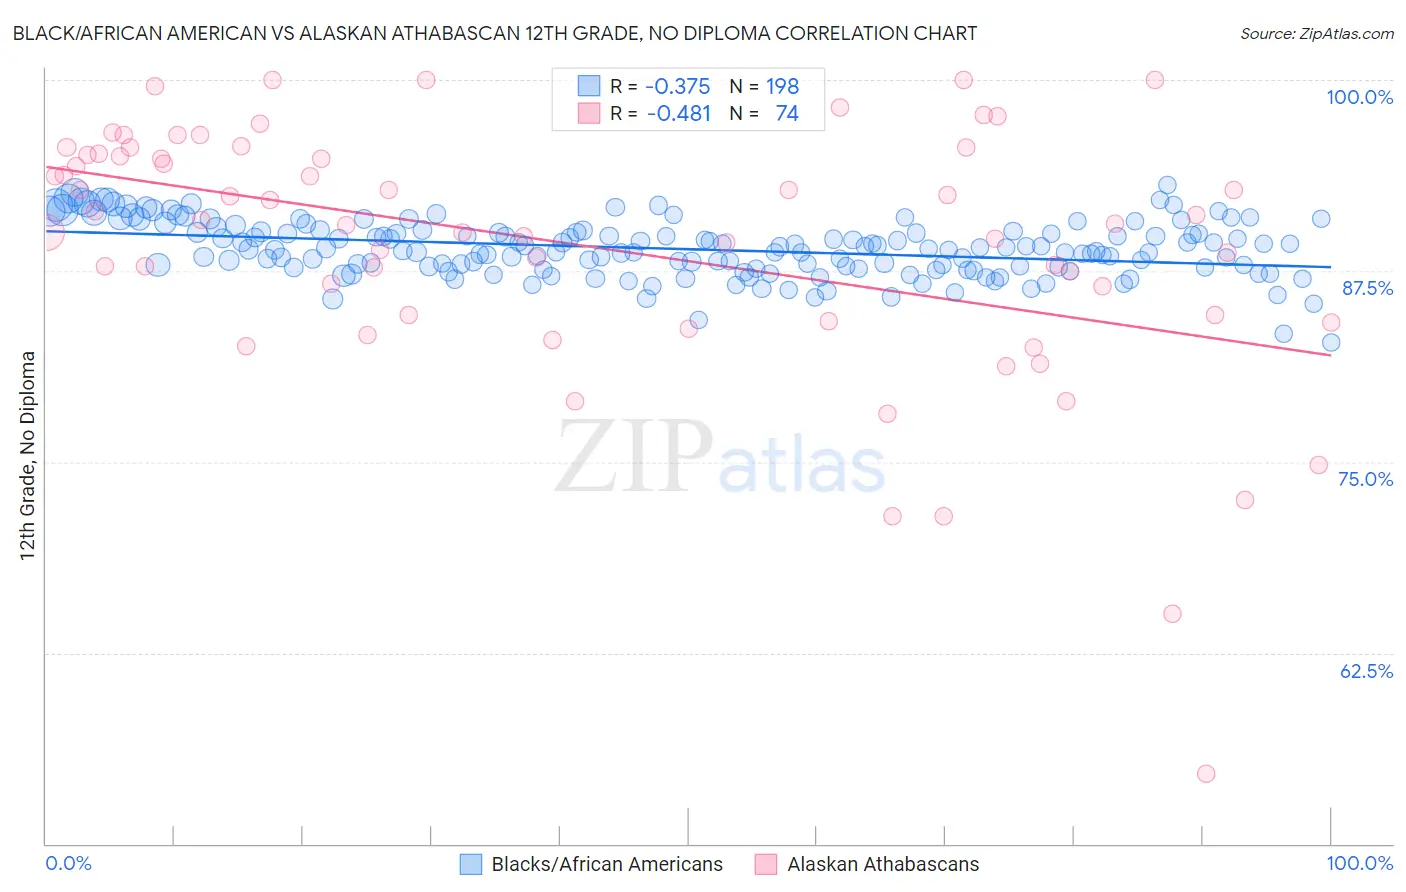
Black/African American vs Alaskan Athabascan 12th Grade, No Diploma Correlation Chart
The statistical analysis conducted on geographies consisting of 566,032,166 people shows a mild negative correlation between the proportion of Blacks/African Americans and percentage of population with at least 12th grade (no diploma) education in the United States with a correlation coefficient (R) of -0.375 and weighted average of 89.3%. Similarly, the statistical analysis conducted on geographies consisting of 45,820,221 people shows a moderate negative correlation between the proportion of Alaskan Athabascans and percentage of population with at least 12th grade (no diploma) education in the United States with a correlation coefficient (R) of -0.481 and weighted average of 92.3%, a difference of 3.4%.
12th Grade, No Diploma Correlation Summary
| Measurement | Black/African American | Alaskan Athabascan |
| Minimum | 82.8% | 54.5% |
| Maximum | 93.1% | 100.0% |
| Range | 10.3% | 45.5% |
| Mean | 88.9% | 89.1% |
| Median | 88.9% | 90.7% |
| Interquartile 25% (IQ1) | 87.7% | 84.6% |
| Interquartile 75% (IQ3) | 90.0% | 95.1% |
| Interquartile Range (IQR) | 2.3% | 10.5% |
| Standard Deviation (Sample) | 1.8% | 8.5% |
| Standard Deviation (Population) | 1.8% | 8.5% |
Similar Demographics by 12th Grade, No Diploma
Demographics Similar to Blacks/African Americans by 12th Grade, No Diploma
In terms of 12th grade, no diploma, the demographic groups most similar to Blacks/African Americans are Bangladeshi (89.3%, a difference of 0.0%), Malaysian (89.2%, a difference of 0.010%), U.S. Virgin Islander (89.3%, a difference of 0.050%), Immigrants from Trinidad and Tobago (89.3%, a difference of 0.080%), and West Indian (89.3%, a difference of 0.10%).
| Demographics | Rating | Rank | 12th Grade, No Diploma |
| Sri Lankans | 0.2 /100 | #264 | Tragic 89.4% |
| Trinidadians and Tobagonians | 0.2 /100 | #265 | Tragic 89.4% |
| Seminole | 0.2 /100 | #266 | Tragic 89.4% |
| West Indians | 0.2 /100 | #267 | Tragic 89.3% |
| Immigrants | Trinidad and Tobago | 0.1 /100 | #268 | Tragic 89.3% |
| U.S. Virgin Islanders | 0.1 /100 | #269 | Tragic 89.3% |
| Bangladeshis | 0.1 /100 | #270 | Tragic 89.3% |
| Blacks/African Americans | 0.1 /100 | #271 | Tragic 89.3% |
| Malaysians | 0.1 /100 | #272 | Tragic 89.2% |
| Barbadians | 0.1 /100 | #273 | Tragic 89.1% |
| Cajuns | 0.1 /100 | #274 | Tragic 89.1% |
| Immigrants | Congo | 0.1 /100 | #275 | Tragic 89.0% |
| Ute | 0.1 /100 | #276 | Tragic 89.0% |
| Immigrants | Barbados | 0.0 /100 | #277 | Tragic 89.0% |
| Immigrants | St. Vincent and the Grenadines | 0.0 /100 | #278 | Tragic 88.9% |
Demographics Similar to Alaskan Athabascans by 12th Grade, No Diploma
In terms of 12th grade, no diploma, the demographic groups most similar to Alaskan Athabascans are Swiss (92.3%, a difference of 0.0%), Immigrants from Norway (92.3%, a difference of 0.0%), Immigrants from Croatia (92.3%, a difference of 0.030%), Immigrants from Korea (92.3%, a difference of 0.040%), and Celtic (92.3%, a difference of 0.050%).
| Demographics | Rating | Rank | 12th Grade, No Diploma |
| Immigrants | North Macedonia | 98.5 /100 | #95 | Exceptional 92.3% |
| Icelanders | 98.5 /100 | #96 | Exceptional 92.3% |
| Celtics | 98.4 /100 | #97 | Exceptional 92.3% |
| Immigrants | Kuwait | 98.4 /100 | #98 | Exceptional 92.3% |
| Immigrants | Korea | 98.3 /100 | #99 | Exceptional 92.3% |
| Immigrants | Croatia | 98.3 /100 | #100 | Exceptional 92.3% |
| Swiss | 98.1 /100 | #101 | Exceptional 92.3% |
| Alaskan Athabascans | 98.1 /100 | #102 | Exceptional 92.3% |
| Immigrants | Norway | 98.1 /100 | #103 | Exceptional 92.3% |
| Lebanese | 97.6 /100 | #104 | Exceptional 92.2% |
| Immigrants | Belarus | 97.4 /100 | #105 | Exceptional 92.2% |
| Immigrants | Russia | 97.3 /100 | #106 | Exceptional 92.2% |
| Syrians | 97.2 /100 | #107 | Exceptional 92.2% |
| Jordanians | 97.2 /100 | #108 | Exceptional 92.2% |
| Immigrants | Hungary | 97.0 /100 | #109 | Exceptional 92.1% |