Blackfeet vs Spanish 1st Grade

COMPARE

Blackfeet
Race
Ancestry
AfghanAfricanAlaska NativeAlaskan AthabascanAlbanianAleutAlsatianAmericanApacheArabArapahoArgentineanArmenianAssyrian/Chaldean/SyriacAustralianAustrianBahamianBangladeshiBarbadianBasqueBelgianBelizeanBermudanBhutaneseBlackfeetBolivianBrazilianBritishBritish West IndianBulgarianBurmeseCajunCambodianCanadianCape VerdeanCarpatho RusynCelticCentral AmericanCentral American IndianCherokeeCheyenneChickasawChileanChineseChippewaChoctawColombianColvilleComancheCosta RicanCreeCreekCroatianCrowCubanCypriotCzechCzechoslovakianDanishDelawareDominicanDutchDutch West IndianEastern EuropeanEcuadorianEgyptianEnglishEstonianEthiopianEuropeanFijianFilipinoFinnishFrenchFrench American IndianFrench CanadianGermanGerman RussianGhanaianGreekGuamanian/ChamorroGuatemalanGuyaneseHaitianHmongHonduranHopiHoumaHungarianIcelanderIndian (Asian)IndonesianInupiatIranianIraqiIrishIroquoisIsraeliItalianJamaicanJapaneseJordanianKenyanKiowaKoreanLaotianLatvianLebaneseLiberianLithuanianLumbeeLuxembourgerMacedonianMalaysianMalteseMarshalleseMenomineeMexicanMexican American IndianMongolianMoroccanNative HawaiianNavajoNepaleseNew ZealanderNicaraguanNigerianNorthern EuropeanNorwegianOkinawanOsageOttawaPaiutePakistaniPalestinianPanamanianParaguayanPennsylvania GermanPeruvianPimaPolishPortuguesePotawatomiPuebloPuerto RicanPuget Sound SalishRomanianRussianSalvadoranSamoanScandinavianScotch-IrishScottishSeminoleSenegaleseSerbianShoshoneSierra LeoneanSiouxSlavicSlovakSloveneSomaliSouth AfricanSouth AmericanSouth American IndianSoviet UnionSpaniardSpanish AmericanSpanish American IndianSri LankanSubsaharan AfricanSudaneseSwedishSwissSyrianTaiwaneseThaiTlingit-HaidaTohono O'OdhamTonganTrinidadian and TobagonianTsimshianTurkishU.S. Virgin IslanderUgandanUkrainianUruguayanUteVenezuelanVietnameseWelshWest IndianYakamaYaquiYugoslavianYumanYup'ikZimbabwean
Immigration
NonimmigrantsImmigrantsAfghanistanAfricaAlbaniaArgentinaArmeniaAsiaAustraliaAustriaBahamasBangladeshBarbadosBelarusBelgiumBelizeBoliviaBosnia and HerzegovinaBrazilBulgariaBurma/MyanmarCabo VerdeCambodiaCameroonCanadaCaribbeanCentral AmericaChileChinaColombiaCongoCosta RicaCroatiaCubaCzechoslovakiaDenmarkDominicaDominican RepublicEastern AfricaEastern AsiaEastern EuropeEcuadorEgyptEl SalvadorEnglandEritreaEthiopiaEuropeFijiFranceGermanyGhanaGreeceGrenadaGuatemalaGuyanaHaitiHondurasHong KongHungaryIndiaIndonesiaIranIraqIrelandIsraelItalyJamaicaJapanJordanKazakhstanKenyaKoreaKuwaitLaosLatin AmericaLatviaLebanonLiberiaLithuaniaMalaysiaMexicoMicronesiaMiddle AfricaMoldovaMoroccoNepalNetherlandsNicaraguaNigeriaNorth AmericaNorth MacedoniaNorthern AfricaNorthern EuropeNorwayOceaniaPakistanPanamaPeruPhilippinesPolandPortugalRomaniaRussiaSaudi ArabiaScotlandSenegalSerbiaSierra LeoneSingaporeSomaliaSouth AfricaSouth AmericaSouth Central AsiaSouth Eastern AsiaSouthern EuropeSpainSri LankaSt. Vincent and the GrenadinesSudanSwedenSwitzerlandSyriaTaiwanThailandTrinidad and TobagoTurkeyUgandaUkraineUruguayUzbekistanVenezuelaVietnamWest IndiesWestern AfricaWestern AsiaWestern EuropeYemenZaireZimbabweAzores
Spanish
Race
Ancestry
AfghanAfricanAlaska NativeAlaskan AthabascanAlbanianAleutAlsatianAmericanApacheArabArapahoArgentineanArmenianAssyrian/Chaldean/SyriacAustralianAustrianBahamianBangladeshiBarbadianBasqueBelgianBelizeanBermudanBhutaneseBolivianBrazilianBritishBritish West IndianBulgarianBurmeseCajunCambodianCanadianCape VerdeanCarpatho RusynCelticCentral AmericanCentral American IndianCherokeeCheyenneChickasawChileanChineseChippewaChoctawColombianColvilleComancheCosta RicanCreeCreekCroatianCrowCubanCypriotCzechCzechoslovakianDanishDelawareDominicanDutchDutch West IndianEastern EuropeanEcuadorianEgyptianEnglishEstonianEthiopianEuropeanFijianFilipinoFinnishFrenchFrench American IndianFrench CanadianGermanGerman RussianGhanaianGreekGuamanian/ChamorroGuatemalanGuyaneseHaitianHmongHonduranHopiHoumaHungarianIcelanderIndian (Asian)IndonesianInupiatIranianIraqiIrishIroquoisIsraeliItalianJamaicanJapaneseJordanianKenyanKiowaKoreanLaotianLatvianLebaneseLiberianLithuanianLumbeeLuxembourgerMacedonianMalaysianMalteseMarshalleseMenomineeMexicanMexican American IndianMongolianMoroccanNative HawaiianNavajoNepaleseNew ZealanderNicaraguanNigerianNorthern EuropeanNorwegianOkinawanOsageOttawaPaiutePakistaniPalestinianPanamanianParaguayanPennsylvania GermanPeruvianPimaPolishPortuguesePotawatomiPuebloPuerto RicanPuget Sound SalishRomanianRussianSalvadoranSamoanScandinavianScotch-IrishScottishSeminoleSenegaleseSerbianShoshoneSierra LeoneanSiouxSlavicSlovakSloveneSomaliSouth AfricanSouth AmericanSouth American IndianSoviet UnionSpaniardSpanishSpanish AmericanSpanish American IndianSri LankanSubsaharan AfricanSudaneseSwedishSwissSyrianTaiwaneseThaiTlingit-HaidaTohono O'OdhamTonganTrinidadian and TobagonianTsimshianTurkishU.S. Virgin IslanderUgandanUkrainianUruguayanUteVenezuelanVietnameseWelshWest IndianYakamaYaquiYugoslavianYumanYup'ikZimbabwean
Immigration
NonimmigrantsImmigrantsAfghanistanAfricaAlbaniaArgentinaArmeniaAsiaAustraliaAustriaBahamasBangladeshBarbadosBelarusBelgiumBelizeBoliviaBosnia and HerzegovinaBrazilBulgariaBurma/MyanmarCabo VerdeCambodiaCameroonCanadaCaribbeanCentral AmericaChileChinaColombiaCongoCosta RicaCroatiaCubaCzechoslovakiaDenmarkDominicaDominican RepublicEastern AfricaEastern AsiaEastern EuropeEcuadorEgyptEl SalvadorEnglandEritreaEthiopiaEuropeFijiFranceGermanyGhanaGreeceGrenadaGuatemalaGuyanaHaitiHondurasHong KongHungaryIndiaIndonesiaIranIraqIrelandIsraelItalyJamaicaJapanJordanKazakhstanKenyaKoreaKuwaitLaosLatin AmericaLatviaLebanonLiberiaLithuaniaMalaysiaMexicoMicronesiaMiddle AfricaMoldovaMoroccoNepalNetherlandsNicaraguaNigeriaNorth AmericaNorth MacedoniaNorthern AfricaNorthern EuropeNorwayOceaniaPakistanPanamaPeruPhilippinesPolandPortugalRomaniaRussiaSaudi ArabiaScotlandSenegalSerbiaSierra LeoneSingaporeSomaliaSouth AfricaSouth AmericaSouth Central AsiaSouth Eastern AsiaSouthern EuropeSpainSri LankaSt. Vincent and the GrenadinesSudanSwedenSwitzerlandSyriaTaiwanThailandTrinidad and TobagoTurkeyUgandaUkraineUruguayUzbekistanVenezuelaVietnamWest IndiesWestern AfricaWestern AsiaWestern EuropeYemenZaireZimbabweAzores
1st Grade
Income
Poverty
Unemployment
Labor Participation
Family Structure
Vehicle Availability
Education Level
Disability

1st Grade Comparison

Blackfeet

Spanish

Excellent
Exceptional
98.1%
1ST GRADE
87.6/ 100
METRIC RATING
139th/ 347
METRIC RANK
98.2%
1ST GRADE
95.9/ 100
METRIC RATING
116th/ 347
METRIC RANK

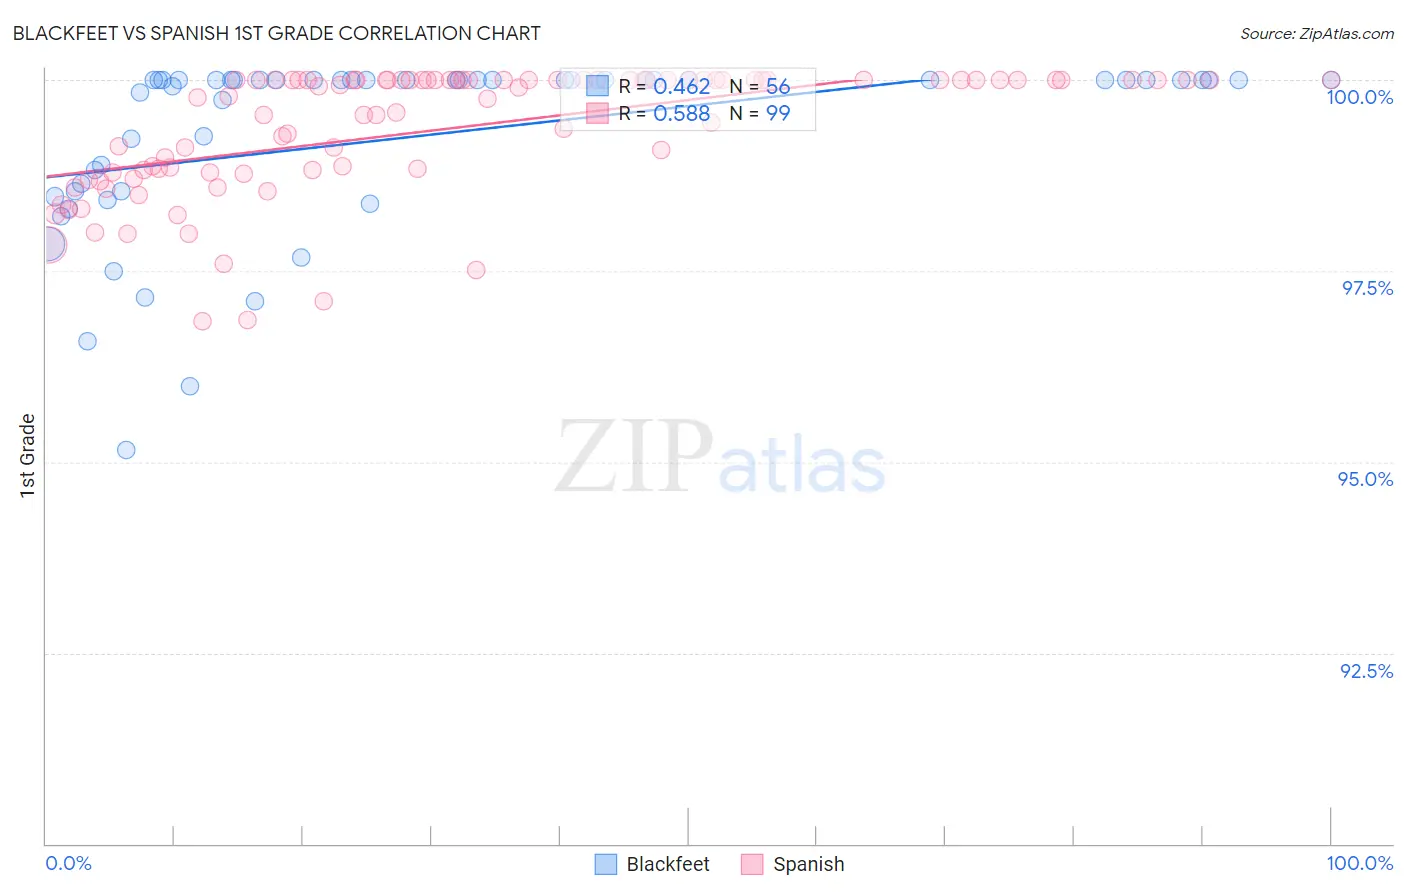
Blackfeet vs Spanish 1st Grade Correlation Chart

The statistical analysis conducted on geographies consisting of 309,580,957 people shows a moderate positive correlation between the proportion of Blackfeet and percentage of population with at least 1st grade education in the United States with a correlation coefficient (R) of 0.462 and weighted average of 98.1%. Similarly, the statistical analysis conducted on geographies consisting of 422,189,210 people shows a substantial positive correlation between the proportion of Spanish and percentage of population with at least 1st grade education in the United States with a correlation coefficient (R) of 0.588 and weighted average of 98.2%, a difference of 0.090%.
Blackfeet vs Spanish 1st Grade

1st Grade Correlation Summary

MeasurementBlackfeetSpanish
Minimum95.2%96.8%
Maximum100.0%100.0%
Range4.8%3.2%
Mean99.3%99.4%
Median100.0%99.9%
Interquartile 25% (IQ1)98.5%98.8%
Interquartile 75% (IQ3)100.0%100.0%
Interquartile Range (IQR)1.5%1.2%
Standard Deviation (Sample)1.2%0.83%
Standard Deviation (Population)1.2%0.82%

Similar Demographics by 1st Grade

Demographics Similar to Blackfeet by 1st Grade

In terms of 1st grade, the demographic groups most similar to Blackfeet are Israeli (98.1%, a difference of 0.0%), Immigrants from Romania (98.1%, a difference of 0.0%), Immigrants from Hungary (98.1%, a difference of 0.010%), Immigrants from Kuwait (98.1%, a difference of 0.010%), and Immigrants from Bulgaria (98.1%, a difference of 0.010%).
DemographicsRating | Rank1st Grade
Cambodians
90.9
/100
|
#132
Exceptional
98.1%
Immigrants | Europe
90.5
/100
|
#133
Exceptional
98.1%
Immigrants | Hungary
89.4
/100
|
#134
Excellent
98.1%
Immigrants | Kuwait
89.3
/100
|
#135
Excellent
98.1%
Immigrants | Bulgaria
88.8
/100
|
#136
Excellent
98.1%
Israelis
87.8
/100
|
#137
Excellent
98.1%
Immigrants | Romania
87.8
/100
|
#138
Excellent
98.1%
Blackfeet
87.6
/100
|
#139
Excellent
98.1%
Palestinians
83.0
/100
|
#140
Excellent
98.0%
Immigrants | Turkey
82.8
/100
|
#141
Excellent
98.0%
Marshallese
82.0
/100
|
#142
Excellent
98.0%
Burmese
81.0
/100
|
#143
Excellent
98.0%
Alsatians
80.9
/100
|
#144
Excellent
98.0%
Hmong
79.0
/100
|
#145
Good
98.0%
Immigrants | Israel
77.8
/100
|
#146
Good
98.0%

Demographics Similar to Spanish by 1st Grade

In terms of 1st grade, the demographic groups most similar to Spanish are Iranian (98.2%, a difference of 0.0%), Immigrants from Latvia (98.2%, a difference of 0.010%), Ute (98.2%, a difference of 0.010%), Yugoslavian (98.2%, a difference of 0.010%), and Immigrants from France (98.2%, a difference of 0.010%).
DemographicsRating | Rank1st Grade
German Russians
97.1
/100
|
#109
Exceptional
98.2%
Immigrants | Singapore
96.7
/100
|
#110
Exceptional
98.2%
Immigrants | Czechoslovakia
96.6
/100
|
#111
Exceptional
98.2%
Immigrants | Norway
96.6
/100
|
#112
Exceptional
98.2%
Immigrants | Latvia
96.4
/100
|
#113
Exceptional
98.2%
Ute
96.2
/100
|
#114
Exceptional
98.2%
Iranians
96.0
/100
|
#115
Exceptional
98.2%
Spanish
95.9
/100
|
#116
Exceptional
98.2%
Yugoslavians
95.5
/100
|
#117
Exceptional
98.2%
Immigrants | France
95.5
/100
|
#118
Exceptional
98.2%
Thais
94.7
/100
|
#119
Exceptional
98.1%
Okinawans
94.5
/100
|
#120
Exceptional
98.1%
Immigrants | Zimbabwe
94.0
/100
|
#121
Exceptional
98.1%
Menominee
93.9
/100
|
#122
Exceptional
98.1%
Iroquois
93.8
/100
|
#123
Exceptional
98.1%