Blackfeet vs Immigrants from Latvia Doctorate Degree

COMPARE

Blackfeet
Race
Ancestry
AfghanAfricanAlaska NativeAlaskan AthabascanAlbanianAleutAlsatianAmericanApacheArabArapahoArgentineanArmenianAssyrian/Chaldean/SyriacAustralianAustrianBahamianBangladeshiBarbadianBasqueBelgianBelizeanBermudanBhutaneseBlackfeetBolivianBrazilianBritishBritish West IndianBulgarianBurmeseCajunCambodianCanadianCape VerdeanCarpatho RusynCelticCentral AmericanCentral American IndianCherokeeCheyenneChickasawChileanChineseChippewaChoctawColombianColvilleComancheCosta RicanCreeCreekCroatianCrowCubanCypriotCzechCzechoslovakianDanishDelawareDominicanDutchDutch West IndianEastern EuropeanEcuadorianEgyptianEnglishEstonianEthiopianEuropeanFijianFilipinoFinnishFrenchFrench American IndianFrench CanadianGermanGerman RussianGhanaianGreekGuamanian/ChamorroGuatemalanGuyaneseHaitianHmongHonduranHopiHoumaHungarianIcelanderIndian (Asian)IndonesianInupiatIranianIraqiIrishIroquoisIsraeliItalianJamaicanJapaneseJordanianKenyanKiowaKoreanLaotianLatvianLebaneseLiberianLithuanianLumbeeLuxembourgerMacedonianMalaysianMalteseMarshalleseMenomineeMexicanMexican American IndianMongolianMoroccanNative HawaiianNavajoNepaleseNew ZealanderNicaraguanNigerianNorthern EuropeanNorwegianOkinawanOsageOttawaPaiutePakistaniPalestinianPanamanianParaguayanPennsylvania GermanPeruvianPimaPolishPortuguesePotawatomiPuebloPuerto RicanPuget Sound SalishRomanianRussianSalvadoranSamoanScandinavianScotch-IrishScottishSeminoleSenegaleseSerbianShoshoneSierra LeoneanSiouxSlavicSlovakSloveneSomaliSouth AfricanSouth AmericanSouth American IndianSoviet UnionSpaniardSpanishSpanish AmericanSpanish American IndianSri LankanSubsaharan AfricanSudaneseSwedishSwissSyrianTaiwaneseThaiTlingit-HaidaTohono O'OdhamTonganTrinidadian and TobagonianTsimshianTurkishU.S. Virgin IslanderUgandanUkrainianUruguayanUteVenezuelanVietnameseWelshWest IndianYakamaYaquiYugoslavianYumanYup'ikZimbabwean
Immigration
NonimmigrantsImmigrantsAfghanistanAfricaAlbaniaArgentinaArmeniaAsiaAustraliaAustriaBahamasBangladeshBarbadosBelarusBelgiumBelizeBoliviaBosnia and HerzegovinaBrazilBulgariaBurma/MyanmarCabo VerdeCambodiaCameroonCanadaCaribbeanCentral AmericaChileChinaColombiaCongoCosta RicaCroatiaCubaCzechoslovakiaDenmarkDominicaDominican RepublicEastern AfricaEastern AsiaEastern EuropeEcuadorEgyptEl SalvadorEnglandEritreaEthiopiaEuropeFijiFranceGermanyGhanaGreeceGrenadaGuatemalaGuyanaHaitiHondurasHong KongHungaryIndiaIndonesiaIranIraqIrelandIsraelItalyJamaicaJapanJordanKazakhstanKenyaKoreaKuwaitLaosLatin AmericaLebanonLiberiaLithuaniaMalaysiaMexicoMicronesiaMiddle AfricaMoldovaMoroccoNepalNetherlandsNicaraguaNigeriaNorth AmericaNorth MacedoniaNorthern AfricaNorthern EuropeNorwayOceaniaPakistanPanamaPeruPhilippinesPolandPortugalRomaniaRussiaSaudi ArabiaScotlandSenegalSerbiaSierra LeoneSingaporeSomaliaSouth AfricaSouth AmericaSouth Central AsiaSouth Eastern AsiaSouthern EuropeSpainSri LankaSt. Vincent and the GrenadinesSudanSwedenSwitzerlandSyriaTaiwanThailandTrinidad and TobagoTurkeyUgandaUkraineUruguayUzbekistanVenezuelaVietnamWest IndiesWestern AfricaWestern AsiaWestern EuropeYemenZaireZimbabweAzores
Immigrants from Latvia
Race
Ancestry
AfghanAfricanAlaska NativeAlaskan AthabascanAlbanianAleutAlsatianAmericanApacheArabArapahoArgentineanArmenianAssyrian/Chaldean/SyriacAustralianAustrianBahamianBangladeshiBarbadianBasqueBelgianBelizeanBermudanBhutaneseBolivianBrazilianBritishBritish West IndianBulgarianBurmeseCajunCambodianCanadianCape VerdeanCarpatho RusynCelticCentral AmericanCentral American IndianCherokeeCheyenneChickasawChileanChineseChippewaChoctawColombianColvilleComancheCosta RicanCreeCreekCroatianCrowCubanCypriotCzechCzechoslovakianDanishDelawareDominicanDutchDutch West IndianEastern EuropeanEcuadorianEgyptianEnglishEstonianEthiopianEuropeanFijianFilipinoFinnishFrenchFrench American IndianFrench CanadianGermanGerman RussianGhanaianGreekGuamanian/ChamorroGuatemalanGuyaneseHaitianHmongHonduranHopiHoumaHungarianIcelanderIndian (Asian)IndonesianInupiatIranianIraqiIrishIroquoisIsraeliItalianJamaicanJapaneseJordanianKenyanKiowaKoreanLaotianLatvianLebaneseLiberianLithuanianLumbeeLuxembourgerMacedonianMalaysianMalteseMarshalleseMenomineeMexicanMexican American IndianMongolianMoroccanNative HawaiianNavajoNepaleseNew ZealanderNicaraguanNigerianNorthern EuropeanNorwegianOkinawanOsageOttawaPaiutePakistaniPalestinianPanamanianParaguayanPennsylvania GermanPeruvianPimaPolishPortuguesePotawatomiPuebloPuerto RicanPuget Sound SalishRomanianRussianSalvadoranSamoanScandinavianScotch-IrishScottishSeminoleSenegaleseSerbianShoshoneSierra LeoneanSiouxSlavicSlovakSloveneSomaliSouth AfricanSouth AmericanSouth American IndianSoviet UnionSpaniardSpanishSpanish AmericanSpanish American IndianSri LankanSubsaharan AfricanSudaneseSwedishSwissSyrianTaiwaneseThaiTlingit-HaidaTohono O'OdhamTonganTrinidadian and TobagonianTsimshianTurkishU.S. Virgin IslanderUgandanUkrainianUruguayanUteVenezuelanVietnameseWelshWest IndianYakamaYaquiYugoslavianYumanYup'ikZimbabwean
Immigration
NonimmigrantsImmigrantsAfghanistanAfricaAlbaniaArgentinaArmeniaAsiaAustraliaAustriaBahamasBangladeshBarbadosBelarusBelgiumBelizeBoliviaBosnia and HerzegovinaBrazilBulgariaBurma/MyanmarCabo VerdeCambodiaCameroonCanadaCaribbeanCentral AmericaChileChinaColombiaCongoCosta RicaCroatiaCubaCzechoslovakiaDenmarkDominicaDominican RepublicEastern AfricaEastern AsiaEastern EuropeEcuadorEgyptEl SalvadorEnglandEritreaEthiopiaEuropeFijiFranceGermanyGhanaGreeceGrenadaGuatemalaGuyanaHaitiHondurasHong KongHungaryIndiaIndonesiaIranIraqIrelandIsraelItalyJamaicaJapanJordanKazakhstanKenyaKoreaKuwaitLaosLatin AmericaLatviaLebanonLiberiaLithuaniaMalaysiaMexicoMicronesiaMiddle AfricaMoldovaMoroccoNepalNetherlandsNicaraguaNigeriaNorth AmericaNorth MacedoniaNorthern AfricaNorthern EuropeNorwayOceaniaPakistanPanamaPeruPhilippinesPolandPortugalRomaniaRussiaSaudi ArabiaScotlandSenegalSerbiaSierra LeoneSingaporeSomaliaSouth AfricaSouth AmericaSouth Central AsiaSouth Eastern AsiaSouthern EuropeSpainSri LankaSt. Vincent and the GrenadinesSudanSwedenSwitzerlandSyriaTaiwanThailandTrinidad and TobagoTurkeyUgandaUkraineUruguayUzbekistanVenezuelaVietnamWest IndiesWestern AfricaWestern AsiaWestern EuropeYemenZaireZimbabweAzores
Doctorate Degree
Income
Poverty
Unemployment
Labor Participation
Family Structure
Vehicle Availability
Education Level
Disability

Doctorate Degree Comparison

Blackfeet

Immigrants from Latvia

Tragic
Exceptional
1.5%
DOCTORATE DEGREE
0.7/ 100
METRIC RATING
264th/ 347
METRIC RANK
2.4%
DOCTORATE DEGREE
100.0/ 100
METRIC RATING
53rd/ 347
METRIC RANK

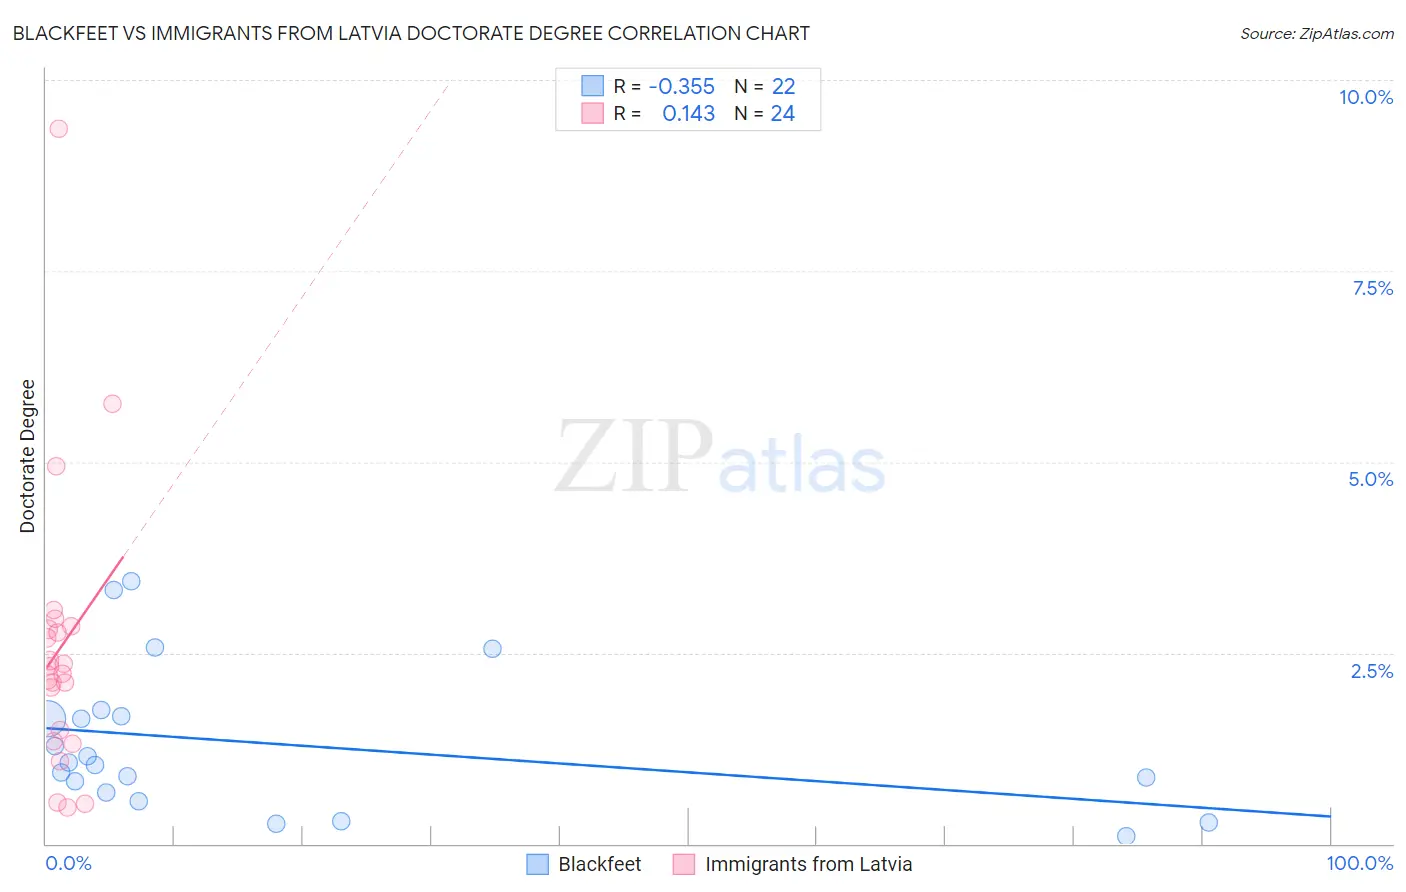
Blackfeet vs Immigrants from Latvia Doctorate Degree Correlation Chart

The statistical analysis conducted on geographies consisting of 304,903,722 people shows a mild negative correlation between the proportion of Blackfeet and percentage of population with at least doctorate degree education in the United States with a correlation coefficient (R) of -0.355 and weighted average of 1.5%. Similarly, the statistical analysis conducted on geographies consisting of 113,595,553 people shows a poor positive correlation between the proportion of Immigrants from Latvia and percentage of population with at least doctorate degree education in the United States with a correlation coefficient (R) of 0.143 and weighted average of 2.4%, a difference of 58.4%.
Blackfeet vs Immigrants from Latvia Doctorate Degree

Doctorate Degree Correlation Summary

MeasurementBlackfeetImmigrants from Latvia
Minimum0.095%0.48%
Maximum3.4%9.4%
Range3.3%8.9%
Mean1.3%2.6%
Median1.0%2.3%
Interquartile 25% (IQ1)0.67%1.4%
Interquartile 75% (IQ3)1.7%2.8%
Interquartile Range (IQR)1.00%1.4%
Standard Deviation (Sample)0.95%1.9%
Standard Deviation (Population)0.93%1.9%

Similar Demographics by Doctorate Degree

Demographics Similar to Blackfeet by Doctorate Degree

In terms of doctorate degree, the demographic groups most similar to Blackfeet are Immigrants from Bahamas (1.5%, a difference of 0.18%), Nicaraguan (1.5%, a difference of 0.28%), Chickasaw (1.5%, a difference of 0.36%), Immigrants from Portugal (1.5%, a difference of 0.51%), and Japanese (1.5%, a difference of 0.97%).
DemographicsRating | RankDoctorate Degree
Chippewa
0.9
/100
|
#257
Tragic
1.5%
Immigrants | West Indies
0.9
/100
|
#258
Tragic
1.5%
Liberians
0.9
/100
|
#259
Tragic
1.5%
Japanese
0.9
/100
|
#260
Tragic
1.5%
Immigrants | Portugal
0.8
/100
|
#261
Tragic
1.5%
Chickasaw
0.7
/100
|
#262
Tragic
1.5%
Immigrants | Bahamas
0.7
/100
|
#263
Tragic
1.5%
Blackfeet
0.7
/100
|
#264
Tragic
1.5%
Nicaraguans
0.6
/100
|
#265
Tragic
1.5%
Immigrants | Liberia
0.5
/100
|
#266
Tragic
1.5%
Kiowa
0.5
/100
|
#267
Tragic
1.5%
U.S. Virgin Islanders
0.5
/100
|
#268
Tragic
1.5%
Crow
0.5
/100
|
#269
Tragic
1.5%
Salvadorans
0.5
/100
|
#270
Tragic
1.5%
Immigrants | Trinidad and Tobago
0.5
/100
|
#271
Tragic
1.5%

Demographics Similar to Immigrants from Latvia by Doctorate Degree

In terms of doctorate degree, the demographic groups most similar to Immigrants from Latvia are Bulgarian (2.4%, a difference of 0.12%), Australian (2.4%, a difference of 0.59%), Immigrants from Norway (2.4%, a difference of 0.68%), Immigrants from Indonesia (2.4%, a difference of 0.68%), and Bolivian (2.4%, a difference of 0.76%).
DemographicsRating | RankDoctorate Degree
Immigrants | Austria
100.0
/100
|
#46
Exceptional
2.4%
Immigrants | Western Europe
100.0
/100
|
#47
Exceptional
2.4%
Asians
100.0
/100
|
#48
Exceptional
2.4%
Immigrants | Asia
100.0
/100
|
#49
Exceptional
2.4%
Immigrants | Norway
100.0
/100
|
#50
Exceptional
2.4%
Australians
100.0
/100
|
#51
Exceptional
2.4%
Bulgarians
100.0
/100
|
#52
Exceptional
2.4%
Immigrants | Latvia
100.0
/100
|
#53
Exceptional
2.4%
Immigrants | Indonesia
100.0
/100
|
#54
Exceptional
2.4%
Bolivians
100.0
/100
|
#55
Exceptional
2.4%
Immigrants | Czechoslovakia
100.0
/100
|
#56
Exceptional
2.4%
Immigrants | Ethiopia
100.0
/100
|
#57
Exceptional
2.4%
Ethiopians
99.9
/100
|
#58
Exceptional
2.3%
South Africans
99.9
/100
|
#59
Exceptional
2.3%
Immigrants | Serbia
99.9
/100
|
#60
Exceptional
2.3%