Bhutanese vs Soviet Union High School Diploma

COMPARE

Bhutanese
Race
Ancestry
AfghanAfricanAlaska NativeAlaskan AthabascanAlbanianAleutAlsatianAmericanApacheArabArapahoArgentineanArmenianAssyrian/Chaldean/SyriacAustralianAustrianBahamianBangladeshiBarbadianBasqueBelgianBelizeanBermudanBhutaneseBlackfeetBolivianBrazilianBritishBritish West IndianBulgarianBurmeseCajunCambodianCanadianCape VerdeanCarpatho RusynCelticCentral AmericanCentral American IndianCherokeeCheyenneChickasawChileanChineseChippewaChoctawColombianColvilleComancheCosta RicanCreeCreekCroatianCrowCubanCypriotCzechCzechoslovakianDanishDelawareDominicanDutchDutch West IndianEastern EuropeanEcuadorianEgyptianEnglishEstonianEthiopianEuropeanFijianFilipinoFinnishFrenchFrench American IndianFrench CanadianGermanGerman RussianGhanaianGreekGuamanian/ChamorroGuatemalanGuyaneseHaitianHmongHonduranHopiHoumaHungarianIcelanderIndian (Asian)IndonesianInupiatIranianIraqiIrishIroquoisIsraeliItalianJamaicanJapaneseJordanianKenyanKiowaKoreanLaotianLatvianLebaneseLiberianLithuanianLumbeeLuxembourgerMacedonianMalaysianMalteseMarshalleseMenomineeMexicanMexican American IndianMongolianMoroccanNative HawaiianNavajoNepaleseNew ZealanderNicaraguanNigerianNorthern EuropeanNorwegianOkinawanOsageOttawaPaiutePakistaniPalestinianPanamanianParaguayanPennsylvania GermanPeruvianPimaPolishPortuguesePotawatomiPuebloPuerto RicanPuget Sound SalishRomanianRussianSalvadoranSamoanScandinavianScotch-IrishScottishSeminoleSenegaleseSerbianShoshoneSierra LeoneanSiouxSlavicSlovakSloveneSomaliSouth AfricanSouth AmericanSouth American IndianSpaniardSpanishSpanish AmericanSpanish American IndianSri LankanSubsaharan AfricanSudaneseSwedishSwissSyrianTaiwaneseThaiTlingit-HaidaTohono O'OdhamTonganTrinidadian and TobagonianTsimshianTurkishU.S. Virgin IslanderUgandanUkrainianUruguayanUteVenezuelanVietnameseWelshWest IndianYakamaYaquiYugoslavianYumanYup'ikZimbabwean
Immigration
NonimmigrantsImmigrantsAfghanistanAfricaAlbaniaArgentinaArmeniaAsiaAustraliaAustriaBahamasBangladeshBarbadosBelarusBelgiumBelizeBoliviaBosnia and HerzegovinaBrazilBulgariaBurma/MyanmarCabo VerdeCambodiaCameroonCanadaCaribbeanCentral AmericaChileChinaColombiaCongoCosta RicaCroatiaCubaCzechoslovakiaDenmarkDominicaDominican RepublicEastern AfricaEastern AsiaEastern EuropeEcuadorEgyptEl SalvadorEnglandEritreaEthiopiaEuropeFijiFranceGermanyGhanaGreeceGrenadaGuatemalaGuyanaHaitiHondurasHong KongHungaryIndiaIndonesiaIranIraqIrelandIsraelItalyJamaicaJapanJordanKazakhstanKenyaKoreaKuwaitLaosLatin AmericaLatviaLebanonLiberiaLithuaniaMalaysiaMexicoMicronesiaMiddle AfricaMoldovaMoroccoNepalNetherlandsNicaraguaNigeriaNorth AmericaNorth MacedoniaNorthern AfricaNorthern EuropeNorwayOceaniaPakistanPanamaPeruPhilippinesPolandPortugalRomaniaRussiaSaudi ArabiaScotlandSenegalSerbiaSierra LeoneSingaporeSomaliaSouth AfricaSouth AmericaSouth Central AsiaSouth Eastern AsiaSouthern EuropeSpainSri LankaSt. Vincent and the GrenadinesSudanSwedenSwitzerlandSyriaTaiwanThailandTrinidad and TobagoTurkeyUgandaUkraineUruguayUzbekistanVenezuelaVietnamWest IndiesWestern AfricaWestern AsiaWestern EuropeYemenZaireZimbabweAzores
Soviet Union
Race
Ancestry
AfghanAfricanAlaska NativeAlaskan AthabascanAlbanianAleutAlsatianAmericanApacheArabArapahoArgentineanArmenianAssyrian/Chaldean/SyriacAustralianAustrianBahamianBangladeshiBarbadianBasqueBelgianBelizeanBermudanBlackfeetBolivianBrazilianBritishBritish West IndianBulgarianBurmeseCajunCambodianCanadianCape VerdeanCarpatho RusynCelticCentral AmericanCentral American IndianCherokeeCheyenneChickasawChileanChineseChippewaChoctawColombianColvilleComancheCosta RicanCreeCreekCroatianCrowCubanCypriotCzechCzechoslovakianDanishDelawareDominicanDutchDutch West IndianEastern EuropeanEcuadorianEgyptianEnglishEstonianEthiopianEuropeanFijianFilipinoFinnishFrenchFrench American IndianFrench CanadianGermanGerman RussianGhanaianGreekGuamanian/ChamorroGuatemalanGuyaneseHaitianHmongHonduranHopiHoumaHungarianIcelanderIndian (Asian)IndonesianInupiatIranianIraqiIrishIroquoisIsraeliItalianJamaicanJapaneseJordanianKenyanKiowaKoreanLaotianLatvianLebaneseLiberianLithuanianLumbeeLuxembourgerMacedonianMalaysianMalteseMarshalleseMenomineeMexicanMexican American IndianMongolianMoroccanNative HawaiianNavajoNepaleseNew ZealanderNicaraguanNigerianNorthern EuropeanNorwegianOkinawanOsageOttawaPaiutePakistaniPalestinianPanamanianParaguayanPennsylvania GermanPeruvianPimaPolishPortuguesePotawatomiPuebloPuerto RicanPuget Sound SalishRomanianRussianSalvadoranSamoanScandinavianScotch-IrishScottishSeminoleSenegaleseSerbianShoshoneSierra LeoneanSiouxSlavicSlovakSloveneSomaliSouth AfricanSouth AmericanSouth American IndianSoviet UnionSpaniardSpanishSpanish AmericanSpanish American IndianSri LankanSubsaharan AfricanSudaneseSwedishSwissSyrianTaiwaneseThaiTlingit-HaidaTohono O'OdhamTonganTrinidadian and TobagonianTsimshianTurkishU.S. Virgin IslanderUgandanUkrainianUruguayanUteVenezuelanVietnameseWelshWest IndianYakamaYaquiYugoslavianYumanYup'ikZimbabwean
Immigration
NonimmigrantsImmigrantsAfghanistanAfricaAlbaniaArgentinaArmeniaAsiaAustraliaAustriaBahamasBangladeshBarbadosBelarusBelgiumBelizeBoliviaBosnia and HerzegovinaBrazilBulgariaBurma/MyanmarCabo VerdeCambodiaCameroonCanadaCaribbeanCentral AmericaChileChinaColombiaCongoCosta RicaCroatiaCubaCzechoslovakiaDenmarkDominicaDominican RepublicEastern AfricaEastern AsiaEastern EuropeEcuadorEgyptEl SalvadorEnglandEritreaEthiopiaEuropeFijiFranceGermanyGhanaGreeceGrenadaGuatemalaGuyanaHaitiHondurasHong KongHungaryIndiaIndonesiaIranIraqIrelandIsraelItalyJamaicaJapanJordanKazakhstanKenyaKoreaKuwaitLaosLatin AmericaLatviaLebanonLiberiaLithuaniaMalaysiaMexicoMicronesiaMiddle AfricaMoldovaMoroccoNepalNetherlandsNicaraguaNigeriaNorth AmericaNorth MacedoniaNorthern AfricaNorthern EuropeNorwayOceaniaPakistanPanamaPeruPhilippinesPolandPortugalRomaniaRussiaSaudi ArabiaScotlandSenegalSerbiaSierra LeoneSingaporeSomaliaSouth AfricaSouth AmericaSouth Central AsiaSouth Eastern AsiaSouthern EuropeSpainSri LankaSt. Vincent and the GrenadinesSudanSwedenSwitzerlandSyriaTaiwanThailandTrinidad and TobagoTurkeyUgandaUkraineUruguayUzbekistanVenezuelaVietnamWest IndiesWestern AfricaWestern AsiaWestern EuropeYemenZaireZimbabweAzores
High School Diploma
Income
Poverty
Unemployment
Labor Participation
Family Structure
Vehicle Availability
Education Level
Disability

High School Diploma Comparison

Bhutanese

Soviet Union

Exceptional
Exceptional
91.2%
HIGH SCHOOL DIPLOMA
99.8/ 100
METRIC RATING
49th/ 347
METRIC RANK
90.9%
HIGH SCHOOL DIPLOMA
99.4/ 100
METRIC RATING
72nd/ 347
METRIC RANK

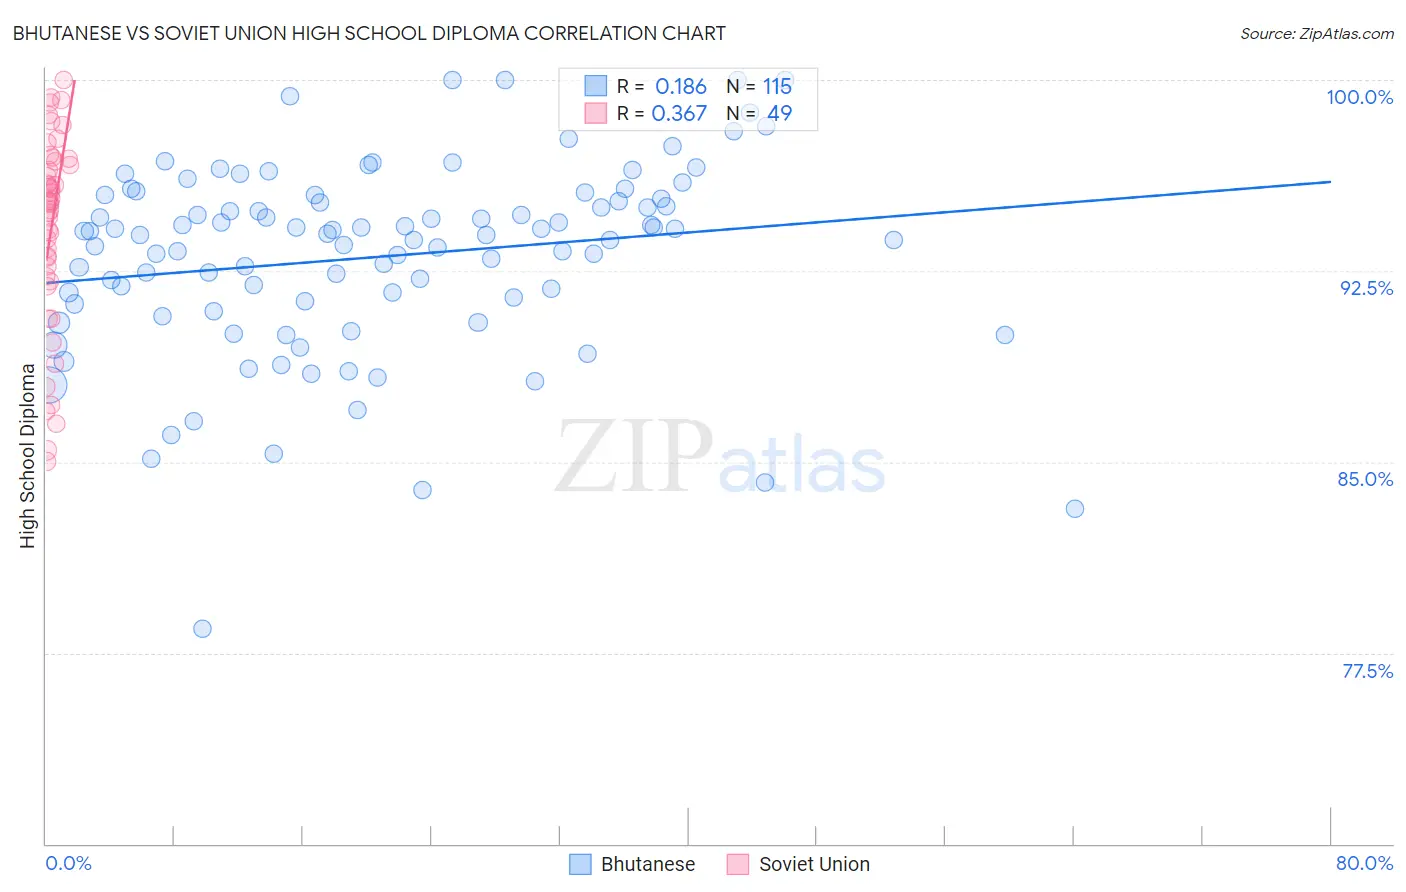
Bhutanese vs Soviet Union High School Diploma Correlation Chart

The statistical analysis conducted on geographies consisting of 455,590,907 people shows a poor positive correlation between the proportion of Bhutanese and percentage of population with at least high school diploma education in the United States with a correlation coefficient (R) of 0.186 and weighted average of 91.2%. Similarly, the statistical analysis conducted on geographies consisting of 43,454,395 people shows a mild positive correlation between the proportion of Soviet Union and percentage of population with at least high school diploma education in the United States with a correlation coefficient (R) of 0.367 and weighted average of 90.9%, a difference of 0.34%.
Bhutanese vs Soviet Union High School Diploma

High School Diploma Correlation Summary

MeasurementBhutaneseSoviet Union
Minimum78.4%85.0%
Maximum100.0%100.0%
Range21.6%15.0%
Mean93.1%94.2%
Median93.9%95.2%
Interquartile 25% (IQ1)91.2%92.2%
Interquartile 75% (IQ3)95.3%96.9%
Interquartile Range (IQR)4.1%4.7%
Standard Deviation (Sample)3.8%3.8%
Standard Deviation (Population)3.7%3.8%

Similar Demographics by High School Diploma

Demographics Similar to Bhutanese by High School Diploma

In terms of high school diploma, the demographic groups most similar to Bhutanese are Australian (91.2%, a difference of 0.010%), Belgian (91.2%, a difference of 0.010%), Greek (91.2%, a difference of 0.020%), Welsh (91.2%, a difference of 0.020%), and Immigrants from Austria (91.3%, a difference of 0.060%).
DemographicsRating | RankHigh School Diploma
Northern Europeans
99.8
/100
|
#42
Exceptional
91.3%
British
99.8
/100
|
#43
Exceptional
91.3%
Immigrants | Austria
99.8
/100
|
#44
Exceptional
91.3%
Turks
99.8
/100
|
#45
Exceptional
91.2%
Greeks
99.8
/100
|
#46
Exceptional
91.2%
Australians
99.8
/100
|
#47
Exceptional
91.2%
Belgians
99.8
/100
|
#48
Exceptional
91.2%
Bhutanese
99.8
/100
|
#49
Exceptional
91.2%
Welsh
99.8
/100
|
#50
Exceptional
91.2%
New Zealanders
99.7
/100
|
#51
Exceptional
91.1%
Immigrants | Sweden
99.7
/100
|
#52
Exceptional
91.1%
Immigrants | Belgium
99.7
/100
|
#53
Exceptional
91.1%
Macedonians
99.7
/100
|
#54
Exceptional
91.1%
Serbians
99.7
/100
|
#55
Exceptional
91.1%
Immigrants | Canada
99.7
/100
|
#56
Exceptional
91.1%

Demographics Similar to Soviet Union by High School Diploma

In terms of high school diploma, the demographic groups most similar to Soviet Union are Alaskan Athabascan (90.9%, a difference of 0.0%), French Canadian (90.9%, a difference of 0.010%), Immigrants from Latvia (90.9%, a difference of 0.010%), Immigrants from South Central Asia (90.9%, a difference of 0.030%), and Czechoslovakian (90.9%, a difference of 0.040%).
DemographicsRating | RankHigh School Diploma
Immigrants | South Africa
99.6
/100
|
#65
Exceptional
91.0%
French
99.5
/100
|
#66
Exceptional
91.0%
Immigrants | Iran
99.5
/100
|
#67
Exceptional
90.9%
Czechoslovakians
99.5
/100
|
#68
Exceptional
90.9%
French Canadians
99.5
/100
|
#69
Exceptional
90.9%
Immigrants | Latvia
99.5
/100
|
#70
Exceptional
90.9%
Alaskan Athabascans
99.4
/100
|
#71
Exceptional
90.9%
Soviet Union
99.4
/100
|
#72
Exceptional
90.9%
Immigrants | South Central Asia
99.4
/100
|
#73
Exceptional
90.9%
Immigrants | Czechoslovakia
99.4
/100
|
#74
Exceptional
90.9%
Cambodians
99.4
/100
|
#75
Exceptional
90.8%
Hungarians
99.3
/100
|
#76
Exceptional
90.8%
Native Hawaiians
99.3
/100
|
#77
Exceptional
90.8%
Burmese
99.3
/100
|
#78
Exceptional
90.8%
Immigrants | Denmark
99.3
/100
|
#79
Exceptional
90.8%