Bhutanese vs Immigrants from El Salvador 9th Grade

COMPARE

Bhutanese
Race
Ancestry
AfghanAfricanAlaska NativeAlaskan AthabascanAlbanianAleutAlsatianAmericanApacheArabArapahoArgentineanArmenianAssyrian/Chaldean/SyriacAustralianAustrianBahamianBangladeshiBarbadianBasqueBelgianBelizeanBermudanBhutaneseBlackfeetBolivianBrazilianBritishBritish West IndianBulgarianBurmeseCajunCambodianCanadianCape VerdeanCarpatho RusynCelticCentral AmericanCentral American IndianCherokeeCheyenneChickasawChileanChineseChippewaChoctawColombianColvilleComancheCosta RicanCreeCreekCroatianCrowCubanCypriotCzechCzechoslovakianDanishDelawareDominicanDutchDutch West IndianEastern EuropeanEcuadorianEgyptianEnglishEstonianEthiopianEuropeanFijianFilipinoFinnishFrenchFrench American IndianFrench CanadianGermanGerman RussianGhanaianGreekGuamanian/ChamorroGuatemalanGuyaneseHaitianHmongHonduranHopiHoumaHungarianIcelanderIndian (Asian)IndonesianInupiatIranianIraqiIrishIroquoisIsraeliItalianJamaicanJapaneseJordanianKenyanKiowaKoreanLaotianLatvianLebaneseLiberianLithuanianLumbeeLuxembourgerMacedonianMalaysianMalteseMarshalleseMenomineeMexicanMexican American IndianMongolianMoroccanNative HawaiianNavajoNepaleseNew ZealanderNicaraguanNigerianNorthern EuropeanNorwegianOkinawanOsageOttawaPaiutePakistaniPalestinianPanamanianParaguayanPennsylvania GermanPeruvianPimaPolishPortuguesePotawatomiPuebloPuerto RicanPuget Sound SalishRomanianRussianSalvadoranSamoanScandinavianScotch-IrishScottishSeminoleSenegaleseSerbianShoshoneSierra LeoneanSiouxSlavicSlovakSloveneSomaliSouth AfricanSouth AmericanSouth American IndianSoviet UnionSpaniardSpanishSpanish AmericanSpanish American IndianSri LankanSubsaharan AfricanSudaneseSwedishSwissSyrianTaiwaneseThaiTlingit-HaidaTohono O'OdhamTonganTrinidadian and TobagonianTsimshianTurkishU.S. Virgin IslanderUgandanUkrainianUruguayanUteVenezuelanVietnameseWelshWest IndianYakamaYaquiYugoslavianYumanYup'ikZimbabwean
Immigration
NonimmigrantsImmigrantsAfghanistanAfricaAlbaniaArgentinaArmeniaAsiaAustraliaAustriaBahamasBangladeshBarbadosBelarusBelgiumBelizeBoliviaBosnia and HerzegovinaBrazilBulgariaBurma/MyanmarCabo VerdeCambodiaCameroonCanadaCaribbeanCentral AmericaChileChinaColombiaCongoCosta RicaCroatiaCubaCzechoslovakiaDenmarkDominicaDominican RepublicEastern AfricaEastern AsiaEastern EuropeEcuadorEgyptEnglandEritreaEthiopiaEuropeFijiFranceGermanyGhanaGreeceGrenadaGuatemalaGuyanaHaitiHondurasHong KongHungaryIndiaIndonesiaIranIraqIrelandIsraelItalyJamaicaJapanJordanKazakhstanKenyaKoreaKuwaitLaosLatin AmericaLatviaLebanonLiberiaLithuaniaMalaysiaMexicoMicronesiaMiddle AfricaMoldovaMoroccoNepalNetherlandsNicaraguaNigeriaNorth AmericaNorth MacedoniaNorthern AfricaNorthern EuropeNorwayOceaniaPakistanPanamaPeruPhilippinesPolandPortugalRomaniaRussiaSaudi ArabiaScotlandSenegalSerbiaSierra LeoneSingaporeSomaliaSouth AfricaSouth AmericaSouth Central AsiaSouth Eastern AsiaSouthern EuropeSpainSri LankaSt. Vincent and the GrenadinesSudanSwedenSwitzerlandSyriaTaiwanThailandTrinidad and TobagoTurkeyUgandaUkraineUruguayUzbekistanVenezuelaVietnamWest IndiesWestern AfricaWestern AsiaWestern EuropeYemenZaireZimbabweAzores
Immigrants from El Salvador
Race
Ancestry
AfghanAfricanAlaska NativeAlaskan AthabascanAlbanianAleutAlsatianAmericanApacheArabArapahoArgentineanArmenianAssyrian/Chaldean/SyriacAustralianAustrianBahamianBangladeshiBarbadianBasqueBelgianBelizeanBermudanBlackfeetBolivianBrazilianBritishBritish West IndianBulgarianBurmeseCajunCambodianCanadianCape VerdeanCarpatho RusynCelticCentral AmericanCentral American IndianCherokeeCheyenneChickasawChileanChineseChippewaChoctawColombianColvilleComancheCosta RicanCreeCreekCroatianCrowCubanCypriotCzechCzechoslovakianDanishDelawareDominicanDutchDutch West IndianEastern EuropeanEcuadorianEgyptianEnglishEstonianEthiopianEuropeanFijianFilipinoFinnishFrenchFrench American IndianFrench CanadianGermanGerman RussianGhanaianGreekGuamanian/ChamorroGuatemalanGuyaneseHaitianHmongHonduranHopiHoumaHungarianIcelanderIndian (Asian)IndonesianInupiatIranianIraqiIrishIroquoisIsraeliItalianJamaicanJapaneseJordanianKenyanKiowaKoreanLaotianLatvianLebaneseLiberianLithuanianLumbeeLuxembourgerMacedonianMalaysianMalteseMarshalleseMenomineeMexicanMexican American IndianMongolianMoroccanNative HawaiianNavajoNepaleseNew ZealanderNicaraguanNigerianNorthern EuropeanNorwegianOkinawanOsageOttawaPaiutePakistaniPalestinianPanamanianParaguayanPennsylvania GermanPeruvianPimaPolishPortuguesePotawatomiPuebloPuerto RicanPuget Sound SalishRomanianRussianSalvadoranSamoanScandinavianScotch-IrishScottishSeminoleSenegaleseSerbianShoshoneSierra LeoneanSiouxSlavicSlovakSloveneSomaliSouth AfricanSouth AmericanSouth American IndianSoviet UnionSpaniardSpanishSpanish AmericanSpanish American IndianSri LankanSubsaharan AfricanSudaneseSwedishSwissSyrianTaiwaneseThaiTlingit-HaidaTohono O'OdhamTonganTrinidadian and TobagonianTsimshianTurkishU.S. Virgin IslanderUgandanUkrainianUruguayanUteVenezuelanVietnameseWelshWest IndianYakamaYaquiYugoslavianYumanYup'ikZimbabwean
Immigration
NonimmigrantsImmigrantsAfghanistanAfricaAlbaniaArgentinaArmeniaAsiaAustraliaAustriaBahamasBangladeshBarbadosBelarusBelgiumBelizeBoliviaBosnia and HerzegovinaBrazilBulgariaBurma/MyanmarCabo VerdeCambodiaCameroonCanadaCaribbeanCentral AmericaChileChinaColombiaCongoCosta RicaCroatiaCubaCzechoslovakiaDenmarkDominicaDominican RepublicEastern AfricaEastern AsiaEastern EuropeEcuadorEgyptEl SalvadorEnglandEritreaEthiopiaEuropeFijiFranceGermanyGhanaGreeceGrenadaGuatemalaGuyanaHaitiHondurasHong KongHungaryIndiaIndonesiaIranIraqIrelandIsraelItalyJamaicaJapanJordanKazakhstanKenyaKoreaKuwaitLaosLatin AmericaLatviaLebanonLiberiaLithuaniaMalaysiaMexicoMicronesiaMiddle AfricaMoldovaMoroccoNepalNetherlandsNicaraguaNigeriaNorth AmericaNorth MacedoniaNorthern AfricaNorthern EuropeNorwayOceaniaPakistanPanamaPeruPhilippinesPolandPortugalRomaniaRussiaSaudi ArabiaScotlandSenegalSerbiaSierra LeoneSingaporeSomaliaSouth AfricaSouth AmericaSouth Central AsiaSouth Eastern AsiaSouthern EuropeSpainSri LankaSt. Vincent and the GrenadinesSudanSwedenSwitzerlandSyriaTaiwanThailandTrinidad and TobagoTurkeyUgandaUkraineUruguayUzbekistanVenezuelaVietnamWest IndiesWestern AfricaWestern AsiaWestern EuropeYemenZaireZimbabweAzores
9th Grade
Income
Poverty
Unemployment
Labor Participation
Family Structure
Vehicle Availability
Education Level
Disability

9th Grade Comparison

Bhutanese

Immigrants from El Salvador

Exceptional
Tragic
95.7%
9TH GRADE
99.3/ 100
METRIC RATING
80th/ 347
METRIC RANK
89.0%
9TH GRADE
0.0/ 100
METRIC RATING
344th/ 347
METRIC RANK

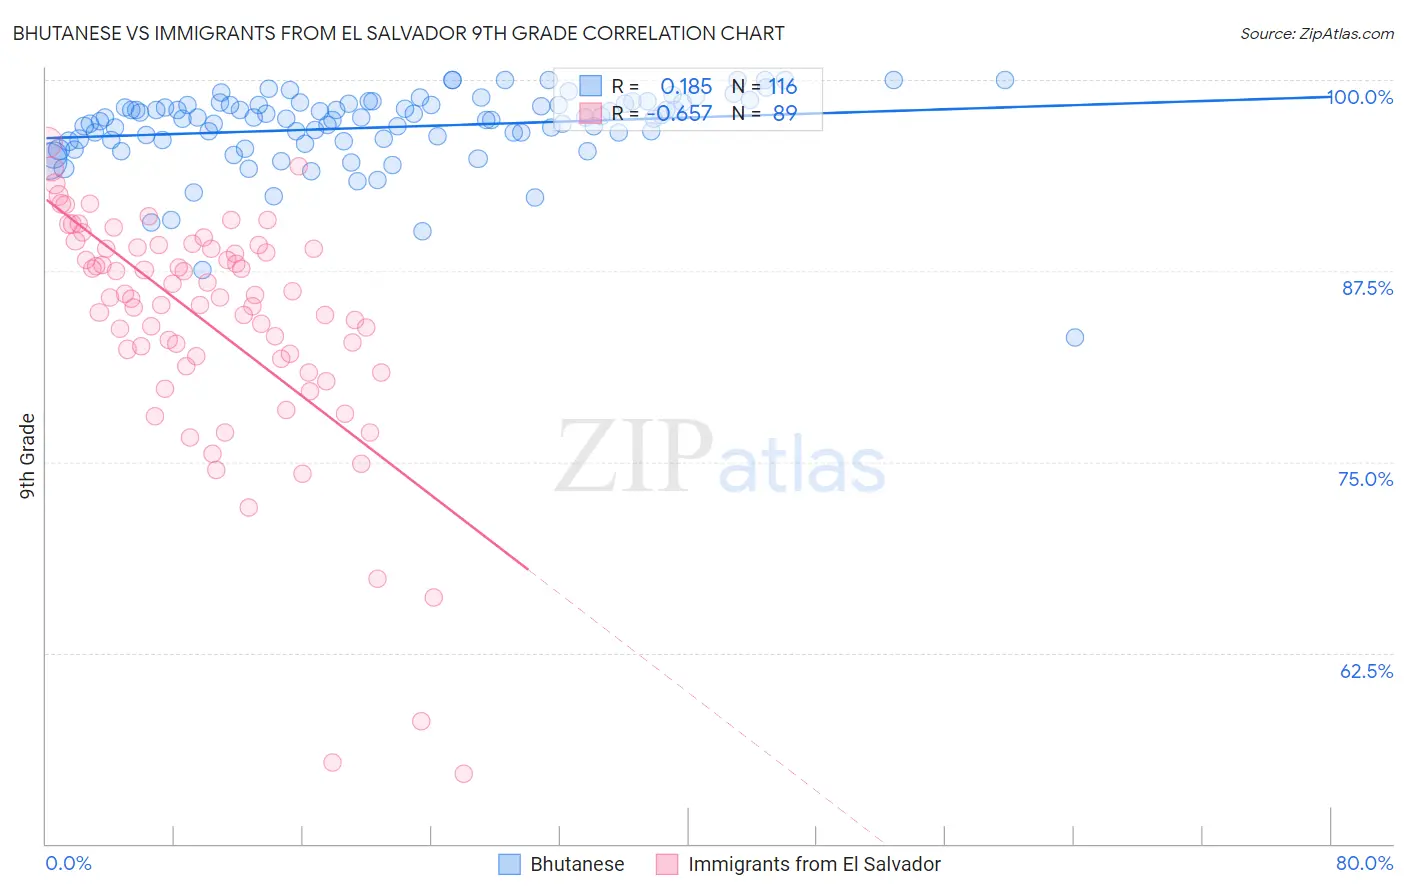
Bhutanese vs Immigrants from El Salvador 9th Grade Correlation Chart

The statistical analysis conducted on geographies consisting of 455,591,134 people shows a poor positive correlation between the proportion of Bhutanese and percentage of population with at least 9th grade education in the United States with a correlation coefficient (R) of 0.185 and weighted average of 95.7%. Similarly, the statistical analysis conducted on geographies consisting of 357,852,634 people shows a significant negative correlation between the proportion of Immigrants from El Salvador and percentage of population with at least 9th grade education in the United States with a correlation coefficient (R) of -0.657 and weighted average of 89.0%, a difference of 7.6%.
Bhutanese vs Immigrants from El Salvador 9th Grade

9th Grade Correlation Summary

MeasurementBhutaneseImmigrants from El Salvador
Minimum83.2%54.6%
Maximum100.0%95.9%
Range16.8%41.3%
Mean96.9%84.1%
Median97.5%85.7%
Interquartile 25% (IQ1)96.1%81.5%
Interquartile 75% (IQ3)98.4%89.0%
Interquartile Range (IQR)2.3%7.5%
Standard Deviation (Sample)2.6%7.8%
Standard Deviation (Population)2.6%7.7%

Similar Demographics by 9th Grade

Demographics Similar to Bhutanese by 9th Grade

In terms of 9th grade, the demographic groups most similar to Bhutanese are Arapaho (95.7%, a difference of 0.0%), Puget Sound Salish (95.7%, a difference of 0.0%), Romanian (95.7%, a difference of 0.020%), Swiss (95.7%, a difference of 0.020%), and Immigrants from Denmark (95.7%, a difference of 0.030%).
DemographicsRating | Rank9th Grade
Immigrants | Singapore
99.5
/100
|
#73
Exceptional
95.8%
Thais
99.5
/100
|
#74
Exceptional
95.8%
Inupiat
99.5
/100
|
#75
Exceptional
95.8%
Immigrants | Sweden
99.5
/100
|
#76
Exceptional
95.8%
Whites/Caucasians
99.4
/100
|
#77
Exceptional
95.8%
Immigrants | South Africa
99.4
/100
|
#78
Exceptional
95.8%
Romanians
99.3
/100
|
#79
Exceptional
95.7%
Bhutanese
99.3
/100
|
#80
Exceptional
95.7%
Arapaho
99.3
/100
|
#81
Exceptional
95.7%
Puget Sound Salish
99.2
/100
|
#82
Exceptional
95.7%
Swiss
99.2
/100
|
#83
Exceptional
95.7%
Immigrants | Denmark
99.1
/100
|
#84
Exceptional
95.7%
Icelanders
99.1
/100
|
#85
Exceptional
95.7%
Immigrants | Western Europe
99.1
/100
|
#86
Exceptional
95.7%
Okinawans
99.0
/100
|
#87
Exceptional
95.7%

Demographics Similar to Immigrants from El Salvador by 9th Grade

In terms of 9th grade, the demographic groups most similar to Immigrants from El Salvador are Immigrants from Central America (89.0%, a difference of 0.020%), Immigrants from Mexico (88.7%, a difference of 0.36%), Immigrants from Guatemala (89.4%, a difference of 0.51%), Salvadoran (89.6%, a difference of 0.71%), and Spanish American Indian (88.3%, a difference of 0.79%).
DemographicsRating | Rank9th Grade
Immigrants | Yemen
0.0
/100
|
#333
Tragic
90.8%
Immigrants | Azores
0.0
/100
|
#334
Tragic
90.8%
Immigrants | Honduras
0.0
/100
|
#335
Tragic
90.6%
Immigrants | Dominican Republic
0.0
/100
|
#336
Tragic
90.5%
Immigrants | Latin America
0.0
/100
|
#337
Tragic
90.4%
Central Americans
0.0
/100
|
#338
Tragic
90.4%
Yakama
0.0
/100
|
#339
Tragic
90.1%
Mexicans
0.0
/100
|
#340
Tragic
90.0%
Guatemalans
0.0
/100
|
#341
Tragic
89.9%
Salvadorans
0.0
/100
|
#342
Tragic
89.6%
Immigrants | Guatemala
0.0
/100
|
#343
Tragic
89.4%
Immigrants | El Salvador
0.0
/100
|
#344
Tragic
89.0%
Immigrants | Central America
0.0
/100
|
#345
Tragic
89.0%
Immigrants | Mexico
0.0
/100
|
#346
Tragic
88.7%
Spanish American Indians
0.0
/100
|
#347
Tragic
88.3%