Basque vs Menominee High School Diploma
COMPARE
Basque
Menominee
High School Diploma
High School Diploma Comparison
Basques
Menominee
89.8%
HIGH SCHOOL DIPLOMA
88.5/ 100
METRIC RATING
129th/ 347
METRIC RANK
90.3%
HIGH SCHOOL DIPLOMA
96.6/ 100
METRIC RATING
111th/ 347
METRIC RANK
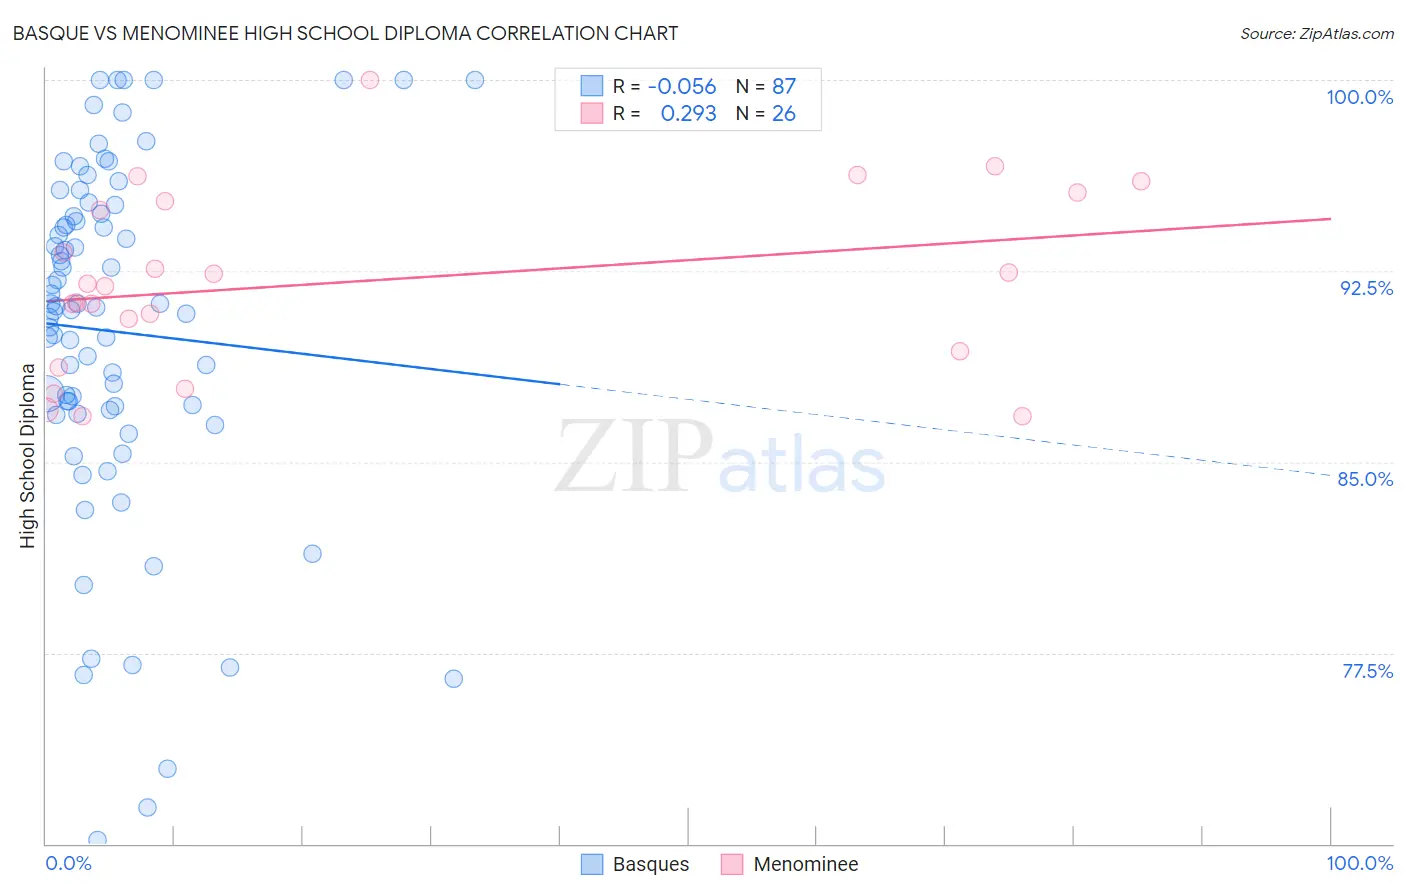
Basque vs Menominee High School Diploma Correlation Chart
The statistical analysis conducted on geographies consisting of 165,778,674 people shows a slight negative correlation between the proportion of Basques and percentage of population with at least high school diploma education in the United States with a correlation coefficient (R) of -0.056 and weighted average of 89.8%. Similarly, the statistical analysis conducted on geographies consisting of 45,778,979 people shows a weak positive correlation between the proportion of Menominee and percentage of population with at least high school diploma education in the United States with a correlation coefficient (R) of 0.293 and weighted average of 90.3%, a difference of 0.49%.
High School Diploma Correlation Summary
| Measurement | Basque | Menominee |
| Minimum | 70.1% | 86.8% |
| Maximum | 100.0% | 100.0% |
| Range | 29.9% | 13.2% |
| Mean | 90.1% | 92.1% |
| Median | 91.1% | 91.9% |
| Interquartile 25% (IQ1) | 87.0% | 89.3% |
| Interquartile 75% (IQ3) | 94.7% | 95.2% |
| Interquartile Range (IQR) | 7.7% | 5.9% |
| Standard Deviation (Sample) | 6.8% | 3.5% |
| Standard Deviation (Population) | 6.8% | 3.4% |
Demographics Similar to Basques and Menominee by High School Diploma
In terms of high school diploma, the demographic groups most similar to Basques are Puget Sound Salish (89.9%, a difference of 0.020%), Immigrants from Ukraine (89.8%, a difference of 0.020%), Immigrants from Eastern Asia (89.9%, a difference of 0.030%), Alaska Native (89.9%, a difference of 0.10%), and Egyptian (89.9%, a difference of 0.11%). Similarly, the demographic groups most similar to Menominee are Immigrants from Greece (90.3%, a difference of 0.0%), Immigrants from Belarus (90.2%, a difference of 0.030%), Immigrants from Sri Lanka (90.2%, a difference of 0.030%), Yugoslavian (90.2%, a difference of 0.040%), and Immigrants from Hungary (90.2%, a difference of 0.080%).
| Demographics | Rating | Rank | High School Diploma |
| Immigrants | Greece | 96.6 /100 | #110 | Exceptional 90.3% |
| Menominee | 96.6 /100 | #111 | Exceptional 90.3% |
| Immigrants | Belarus | 96.4 /100 | #112 | Exceptional 90.2% |
| Immigrants | Sri Lanka | 96.3 /100 | #113 | Exceptional 90.2% |
| Yugoslavians | 96.2 /100 | #114 | Exceptional 90.2% |
| Immigrants | Hungary | 95.8 /100 | #115 | Exceptional 90.2% |
| Immigrants | Germany | 95.7 /100 | #116 | Exceptional 90.2% |
| Jordanians | 95.4 /100 | #117 | Exceptional 90.2% |
| Israelis | 95.1 /100 | #118 | Exceptional 90.1% |
| Immigrants | Eastern Europe | 94.9 /100 | #119 | Exceptional 90.1% |
| Ottawa | 94.4 /100 | #120 | Exceptional 90.1% |
| Whites/Caucasians | 94.1 /100 | #121 | Exceptional 90.1% |
| Immigrants | Kazakhstan | 93.4 /100 | #122 | Exceptional 90.0% |
| German Russians | 92.0 /100 | #123 | Exceptional 90.0% |
| Mongolians | 91.6 /100 | #124 | Exceptional 89.9% |
| Egyptians | 91.1 /100 | #125 | Exceptional 89.9% |
| Alaska Natives | 91.0 /100 | #126 | Exceptional 89.9% |
| Immigrants | Eastern Asia | 89.2 /100 | #127 | Excellent 89.9% |
| Puget Sound Salish | 89.1 /100 | #128 | Excellent 89.9% |
| Basques | 88.5 /100 | #129 | Excellent 89.8% |
| Immigrants | Ukraine | 87.9 /100 | #130 | Excellent 89.8% |