Basque vs Immigrants from Eastern Europe 6th Grade

COMPARE

Basque
Race
Ancestry
AfghanAfricanAlaska NativeAlaskan AthabascanAlbanianAleutAlsatianAmericanApacheArabArapahoArgentineanArmenianAssyrian/Chaldean/SyriacAustralianAustrianBahamianBangladeshiBarbadianBasqueBelgianBelizeanBermudanBhutaneseBlackfeetBolivianBrazilianBritishBritish West IndianBulgarianBurmeseCajunCambodianCanadianCape VerdeanCarpatho RusynCelticCentral AmericanCentral American IndianCherokeeCheyenneChickasawChileanChineseChippewaChoctawColombianColvilleComancheCosta RicanCreeCreekCroatianCrowCubanCypriotCzechCzechoslovakianDanishDelawareDominicanDutchDutch West IndianEastern EuropeanEcuadorianEgyptianEnglishEstonianEthiopianEuropeanFijianFilipinoFinnishFrenchFrench American IndianFrench CanadianGermanGerman RussianGhanaianGreekGuamanian/ChamorroGuatemalanGuyaneseHaitianHmongHonduranHopiHoumaHungarianIcelanderIndian (Asian)IndonesianInupiatIranianIraqiIrishIroquoisIsraeliItalianJamaicanJapaneseJordanianKenyanKiowaKoreanLaotianLatvianLebaneseLiberianLithuanianLumbeeLuxembourgerMacedonianMalaysianMalteseMarshalleseMenomineeMexicanMexican American IndianMongolianMoroccanNative HawaiianNavajoNepaleseNew ZealanderNicaraguanNigerianNorthern EuropeanNorwegianOkinawanOsageOttawaPaiutePakistaniPalestinianPanamanianParaguayanPennsylvania GermanPeruvianPimaPolishPortuguesePotawatomiPuebloPuerto RicanPuget Sound SalishRomanianRussianSalvadoranSamoanScandinavianScotch-IrishScottishSeminoleSenegaleseSerbianShoshoneSierra LeoneanSiouxSlavicSlovakSloveneSomaliSouth AfricanSouth AmericanSouth American IndianSoviet UnionSpaniardSpanishSpanish AmericanSpanish American IndianSri LankanSubsaharan AfricanSudaneseSwedishSwissSyrianTaiwaneseThaiTlingit-HaidaTohono O'OdhamTonganTrinidadian and TobagonianTsimshianTurkishU.S. Virgin IslanderUgandanUkrainianUruguayanUteVenezuelanVietnameseWelshWest IndianYakamaYaquiYugoslavianYumanYup'ikZimbabwean
Immigration
NonimmigrantsImmigrantsAfghanistanAfricaAlbaniaArgentinaArmeniaAsiaAustraliaAustriaBahamasBangladeshBarbadosBelarusBelgiumBelizeBoliviaBosnia and HerzegovinaBrazilBulgariaBurma/MyanmarCabo VerdeCambodiaCameroonCanadaCaribbeanCentral AmericaChileChinaColombiaCongoCosta RicaCroatiaCubaCzechoslovakiaDenmarkDominicaDominican RepublicEastern AfricaEastern AsiaEcuadorEgyptEl SalvadorEnglandEritreaEthiopiaEuropeFijiFranceGermanyGhanaGreeceGrenadaGuatemalaGuyanaHaitiHondurasHong KongHungaryIndiaIndonesiaIranIraqIrelandIsraelItalyJamaicaJapanJordanKazakhstanKenyaKoreaKuwaitLaosLatin AmericaLatviaLebanonLiberiaLithuaniaMalaysiaMexicoMicronesiaMiddle AfricaMoldovaMoroccoNepalNetherlandsNicaraguaNigeriaNorth AmericaNorth MacedoniaNorthern AfricaNorthern EuropeNorwayOceaniaPakistanPanamaPeruPhilippinesPolandPortugalRomaniaRussiaSaudi ArabiaScotlandSenegalSerbiaSierra LeoneSingaporeSomaliaSouth AfricaSouth AmericaSouth Central AsiaSouth Eastern AsiaSouthern EuropeSpainSri LankaSt. Vincent and the GrenadinesSudanSwedenSwitzerlandSyriaTaiwanThailandTrinidad and TobagoTurkeyUgandaUkraineUruguayUzbekistanVenezuelaVietnamWest IndiesWestern AfricaWestern AsiaWestern EuropeYemenZaireZimbabweAzores
Immigrants from Eastern Europe
Race
Ancestry
AfghanAfricanAlaska NativeAlaskan AthabascanAlbanianAleutAlsatianAmericanApacheArabArapahoArgentineanArmenianAssyrian/Chaldean/SyriacAustralianAustrianBahamianBangladeshiBarbadianBelgianBelizeanBermudanBhutaneseBlackfeetBolivianBrazilianBritishBritish West IndianBulgarianBurmeseCajunCambodianCanadianCape VerdeanCarpatho RusynCelticCentral AmericanCentral American IndianCherokeeCheyenneChickasawChileanChineseChippewaChoctawColombianColvilleComancheCosta RicanCreeCreekCroatianCrowCubanCypriotCzechCzechoslovakianDanishDelawareDominicanDutchDutch West IndianEastern EuropeanEcuadorianEgyptianEnglishEstonianEthiopianEuropeanFijianFilipinoFinnishFrenchFrench American IndianFrench CanadianGermanGerman RussianGhanaianGreekGuamanian/ChamorroGuatemalanGuyaneseHaitianHmongHonduranHopiHoumaHungarianIcelanderIndian (Asian)IndonesianInupiatIranianIraqiIrishIroquoisIsraeliItalianJamaicanJapaneseJordanianKenyanKiowaKoreanLaotianLatvianLebaneseLiberianLithuanianLumbeeLuxembourgerMacedonianMalaysianMalteseMarshalleseMenomineeMexicanMexican American IndianMongolianMoroccanNative HawaiianNavajoNepaleseNew ZealanderNicaraguanNigerianNorthern EuropeanNorwegianOkinawanOsageOttawaPaiutePakistaniPalestinianPanamanianParaguayanPennsylvania GermanPeruvianPimaPolishPortuguesePotawatomiPuebloPuerto RicanPuget Sound SalishRomanianRussianSalvadoranSamoanScandinavianScotch-IrishScottishSeminoleSenegaleseSerbianShoshoneSierra LeoneanSiouxSlavicSlovakSloveneSomaliSouth AfricanSouth AmericanSouth American IndianSoviet UnionSpaniardSpanishSpanish AmericanSpanish American IndianSri LankanSubsaharan AfricanSudaneseSwedishSwissSyrianTaiwaneseThaiTlingit-HaidaTohono O'OdhamTonganTrinidadian and TobagonianTsimshianTurkishU.S. Virgin IslanderUgandanUkrainianUruguayanUteVenezuelanVietnameseWelshWest IndianYakamaYaquiYugoslavianYumanYup'ikZimbabwean
Immigration
NonimmigrantsImmigrantsAfghanistanAfricaAlbaniaArgentinaArmeniaAsiaAustraliaAustriaBahamasBangladeshBarbadosBelarusBelgiumBelizeBoliviaBosnia and HerzegovinaBrazilBulgariaBurma/MyanmarCabo VerdeCambodiaCameroonCanadaCaribbeanCentral AmericaChileChinaColombiaCongoCosta RicaCroatiaCubaCzechoslovakiaDenmarkDominicaDominican RepublicEastern AfricaEastern AsiaEastern EuropeEcuadorEgyptEl SalvadorEnglandEritreaEthiopiaEuropeFijiFranceGermanyGhanaGreeceGrenadaGuatemalaGuyanaHaitiHondurasHong KongHungaryIndiaIndonesiaIranIraqIrelandIsraelItalyJamaicaJapanJordanKazakhstanKenyaKoreaKuwaitLaosLatin AmericaLatviaLebanonLiberiaLithuaniaMalaysiaMexicoMicronesiaMiddle AfricaMoldovaMoroccoNepalNetherlandsNicaraguaNigeriaNorth AmericaNorth MacedoniaNorthern AfricaNorthern EuropeNorwayOceaniaPakistanPanamaPeruPhilippinesPolandPortugalRomaniaRussiaSaudi ArabiaScotlandSenegalSerbiaSierra LeoneSingaporeSomaliaSouth AfricaSouth AmericaSouth Central AsiaSouth Eastern AsiaSouthern EuropeSpainSri LankaSt. Vincent and the GrenadinesSudanSwedenSwitzerlandSyriaTaiwanThailandTrinidad and TobagoTurkeyUgandaUkraineUruguayUzbekistanVenezuelaVietnamWest IndiesWestern AfricaWestern AsiaWestern EuropeYemenZaireZimbabweAzores
6th Grade
Income
Poverty
Unemployment
Labor Participation
Family Structure
Vehicle Availability
Education Level
Disability

6th Grade Comparison

Basques

Immigrants from Eastern Europe

Exceptional
Good
97.4%
6TH GRADE
95.4/ 100
METRIC RATING
117th/ 347
METRIC RANK
97.2%
6TH GRADE
72.6/ 100
METRIC RATING
153rd/ 347
METRIC RANK

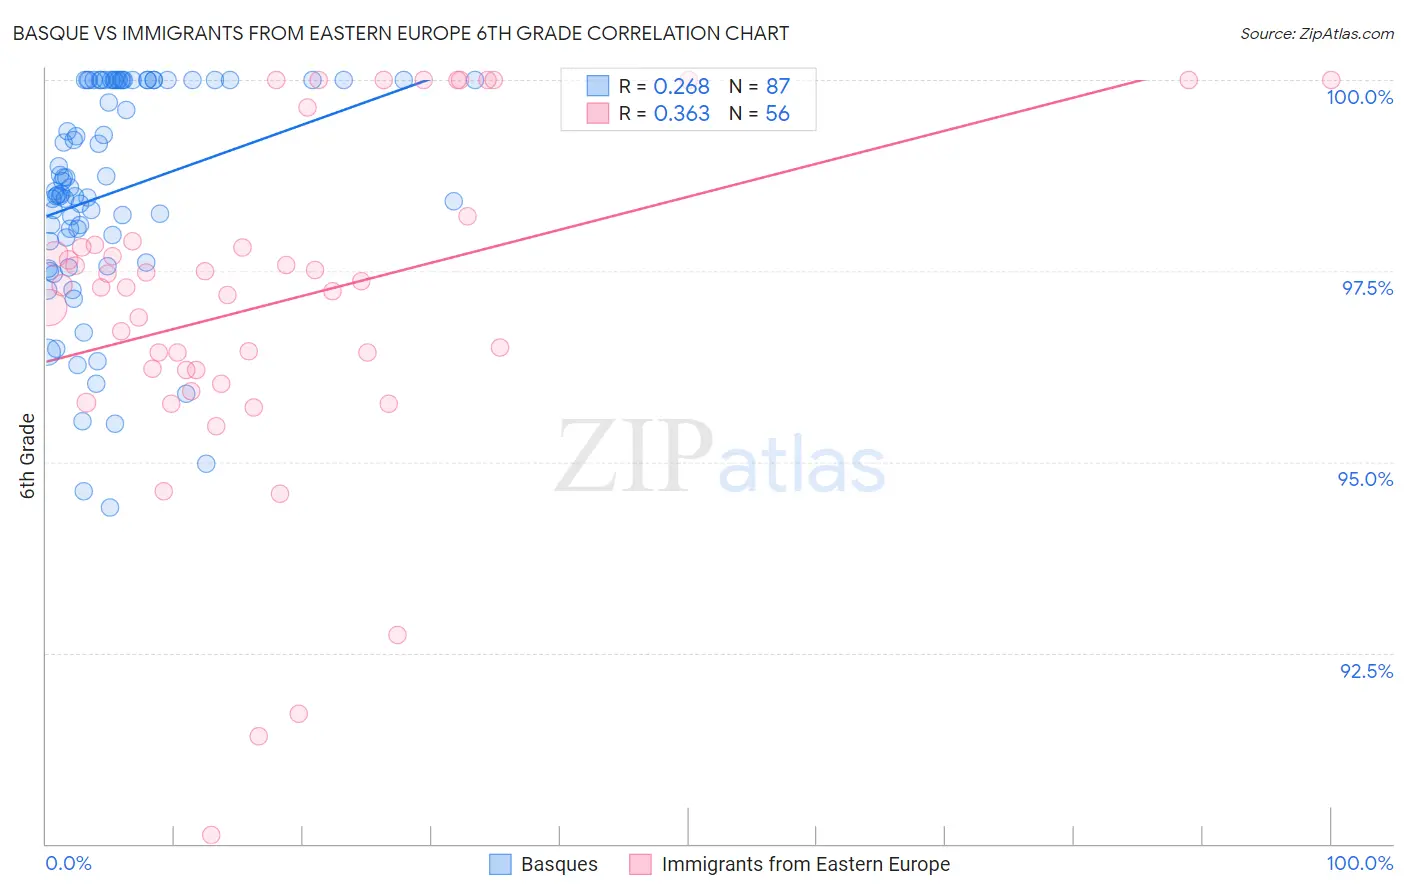
Basque vs Immigrants from Eastern Europe 6th Grade Correlation Chart

The statistical analysis conducted on geographies consisting of 165,772,632 people shows a weak positive correlation between the proportion of Basques and percentage of population with at least 6th grade education in the United States with a correlation coefficient (R) of 0.268 and weighted average of 97.4%. Similarly, the statistical analysis conducted on geographies consisting of 475,879,420 people shows a mild positive correlation between the proportion of Immigrants from Eastern Europe and percentage of population with at least 6th grade education in the United States with a correlation coefficient (R) of 0.363 and weighted average of 97.2%, a difference of 0.23%.
Basque vs Immigrants from Eastern Europe 6th Grade

6th Grade Correlation Summary

MeasurementBasqueImmigrants from Eastern Europe
Minimum94.4%90.1%
Maximum100.0%100.0%
Range5.6%9.9%
Mean98.5%97.1%
Median98.5%97.3%
Interquartile 25% (IQ1)97.9%96.2%
Interquartile 75% (IQ3)100.0%97.9%
Interquartile Range (IQR)2.1%1.7%
Standard Deviation (Sample)1.4%2.2%
Standard Deviation (Population)1.4%2.2%

Similar Demographics by 6th Grade

Demographics Similar to Basques by 6th Grade

In terms of 6th grade, the demographic groups most similar to Basques are Lebanese (97.4%, a difference of 0.0%), Immigrants from Japan (97.4%, a difference of 0.0%), Immigrants from Switzerland (97.4%, a difference of 0.010%), Immigrants from Zimbabwe (97.4%, a difference of 0.010%), and Syrian (97.4%, a difference of 0.010%).
DemographicsRating | Rank6th Grade
Thais
96.9
/100
|
#110
Exceptional
97.4%
Iroquois
96.9
/100
|
#111
Exceptional
97.4%
Immigrants | Latvia
96.7
/100
|
#112
Exceptional
97.4%
Immigrants | Saudi Arabia
96.5
/100
|
#113
Exceptional
97.4%
Colville
96.4
/100
|
#114
Exceptional
97.4%
Immigrants | Switzerland
95.7
/100
|
#115
Exceptional
97.4%
Lebanese
95.5
/100
|
#116
Exceptional
97.4%
Basques
95.4
/100
|
#117
Exceptional
97.4%
Immigrants | Japan
95.2
/100
|
#118
Exceptional
97.4%
Immigrants | Zimbabwe
95.0
/100
|
#119
Exceptional
97.4%
Syrians
94.8
/100
|
#120
Exceptional
97.4%
Immigrants | Norway
94.7
/100
|
#121
Exceptional
97.4%
Immigrants | France
94.5
/100
|
#122
Exceptional
97.4%
Hmong
94.4
/100
|
#123
Exceptional
97.4%
Okinawans
94.2
/100
|
#124
Exceptional
97.4%

Demographics Similar to Immigrants from Eastern Europe by 6th Grade

In terms of 6th grade, the demographic groups most similar to Immigrants from Eastern Europe are Immigrants from Jordan (97.2%, a difference of 0.0%), Immigrants from Bosnia and Herzegovina (97.2%, a difference of 0.010%), French American Indian (97.2%, a difference of 0.010%), Soviet Union (97.2%, a difference of 0.010%), and Ute (97.1%, a difference of 0.010%).
DemographicsRating | Rank6th Grade
Hopi
78.8
/100
|
#146
Good
97.2%
Immigrants | South Central Asia
78.1
/100
|
#147
Good
97.2%
Immigrants | Greece
77.8
/100
|
#148
Good
97.2%
Immigrants | Israel
76.0
/100
|
#149
Good
97.2%
Immigrants | Bosnia and Herzegovina
74.8
/100
|
#150
Good
97.2%
French American Indians
74.0
/100
|
#151
Good
97.2%
Immigrants | Jordan
73.0
/100
|
#152
Good
97.2%
Immigrants | Eastern Europe
72.6
/100
|
#153
Good
97.2%
Soviet Union
71.5
/100
|
#154
Good
97.2%
Ute
71.1
/100
|
#155
Good
97.1%
Alsatians
69.8
/100
|
#156
Good
97.1%
Immigrants | Russia
67.6
/100
|
#157
Good
97.1%
Immigrants | Iran
63.3
/100
|
#158
Good
97.1%
Kenyans
62.9
/100
|
#159
Good
97.1%
Ugandans
62.2
/100
|
#160
Good
97.1%