Basque vs Guatemalan 8th Grade

COMPARE

Basque
Race
Ancestry
AfghanAfricanAlaska NativeAlaskan AthabascanAlbanianAleutAlsatianAmericanApacheArabArapahoArgentineanArmenianAssyrian/Chaldean/SyriacAustralianAustrianBahamianBangladeshiBarbadianBasqueBelgianBelizeanBermudanBhutaneseBlackfeetBolivianBrazilianBritishBritish West IndianBulgarianBurmeseCajunCambodianCanadianCape VerdeanCarpatho RusynCelticCentral AmericanCentral American IndianCherokeeCheyenneChickasawChileanChineseChippewaChoctawColombianColvilleComancheCosta RicanCreeCreekCroatianCrowCubanCypriotCzechCzechoslovakianDanishDelawareDominicanDutchDutch West IndianEastern EuropeanEcuadorianEgyptianEnglishEstonianEthiopianEuropeanFijianFilipinoFinnishFrenchFrench American IndianFrench CanadianGermanGerman RussianGhanaianGreekGuamanian/ChamorroGuyaneseHaitianHmongHonduranHopiHoumaHungarianIcelanderIndian (Asian)IndonesianInupiatIranianIraqiIrishIroquoisIsraeliItalianJamaicanJapaneseJordanianKenyanKiowaKoreanLaotianLatvianLebaneseLiberianLithuanianLumbeeLuxembourgerMacedonianMalaysianMalteseMarshalleseMenomineeMexicanMexican American IndianMongolianMoroccanNative HawaiianNavajoNepaleseNew ZealanderNicaraguanNigerianNorthern EuropeanNorwegianOkinawanOsageOttawaPaiutePakistaniPalestinianPanamanianParaguayanPennsylvania GermanPeruvianPimaPolishPortuguesePotawatomiPuebloPuerto RicanPuget Sound SalishRomanianRussianSalvadoranSamoanScandinavianScotch-IrishScottishSeminoleSenegaleseSerbianShoshoneSierra LeoneanSiouxSlavicSlovakSloveneSomaliSouth AfricanSouth AmericanSouth American IndianSoviet UnionSpaniardSpanishSpanish AmericanSpanish American IndianSri LankanSubsaharan AfricanSudaneseSwedishSwissSyrianTaiwaneseThaiTlingit-HaidaTohono O'OdhamTonganTrinidadian and TobagonianTsimshianTurkishU.S. Virgin IslanderUgandanUkrainianUruguayanUteVenezuelanVietnameseWelshWest IndianYakamaYaquiYugoslavianYumanYup'ikZimbabwean
Immigration
NonimmigrantsImmigrantsAfghanistanAfricaAlbaniaArgentinaArmeniaAsiaAustraliaAustriaBahamasBangladeshBarbadosBelarusBelgiumBelizeBoliviaBosnia and HerzegovinaBrazilBulgariaBurma/MyanmarCabo VerdeCambodiaCameroonCanadaCaribbeanCentral AmericaChileChinaColombiaCongoCosta RicaCroatiaCubaCzechoslovakiaDenmarkDominicaDominican RepublicEastern AfricaEastern AsiaEastern EuropeEcuadorEgyptEl SalvadorEnglandEritreaEthiopiaEuropeFijiFranceGermanyGhanaGreeceGrenadaGuatemalaGuyanaHaitiHondurasHong KongHungaryIndiaIndonesiaIranIraqIrelandIsraelItalyJamaicaJapanJordanKazakhstanKenyaKoreaKuwaitLaosLatin AmericaLatviaLebanonLiberiaLithuaniaMalaysiaMexicoMicronesiaMiddle AfricaMoldovaMoroccoNepalNetherlandsNicaraguaNigeriaNorth AmericaNorth MacedoniaNorthern AfricaNorthern EuropeNorwayOceaniaPakistanPanamaPeruPhilippinesPolandPortugalRomaniaRussiaSaudi ArabiaScotlandSenegalSerbiaSierra LeoneSingaporeSomaliaSouth AfricaSouth AmericaSouth Central AsiaSouth Eastern AsiaSouthern EuropeSpainSri LankaSt. Vincent and the GrenadinesSudanSwedenSwitzerlandSyriaTaiwanThailandTrinidad and TobagoTurkeyUgandaUkraineUruguayUzbekistanVenezuelaVietnamWest IndiesWestern AfricaWestern AsiaWestern EuropeYemenZaireZimbabweAzores
Guatemalan
Race
Ancestry
AfghanAfricanAlaska NativeAlaskan AthabascanAlbanianAleutAlsatianAmericanApacheArabArapahoArgentineanArmenianAssyrian/Chaldean/SyriacAustralianAustrianBahamianBangladeshiBarbadianBelgianBelizeanBermudanBhutaneseBlackfeetBolivianBrazilianBritishBritish West IndianBulgarianBurmeseCajunCambodianCanadianCape VerdeanCarpatho RusynCelticCentral AmericanCentral American IndianCherokeeCheyenneChickasawChileanChineseChippewaChoctawColombianColvilleComancheCosta RicanCreeCreekCroatianCrowCubanCypriotCzechCzechoslovakianDanishDelawareDominicanDutchDutch West IndianEastern EuropeanEcuadorianEgyptianEnglishEstonianEthiopianEuropeanFijianFilipinoFinnishFrenchFrench American IndianFrench CanadianGermanGerman RussianGhanaianGreekGuamanian/ChamorroGuatemalanGuyaneseHaitianHmongHonduranHopiHoumaHungarianIcelanderIndian (Asian)IndonesianInupiatIranianIraqiIrishIroquoisIsraeliItalianJamaicanJapaneseJordanianKenyanKiowaKoreanLaotianLatvianLebaneseLiberianLithuanianLumbeeLuxembourgerMacedonianMalaysianMalteseMarshalleseMenomineeMexicanMexican American IndianMongolianMoroccanNative HawaiianNavajoNepaleseNew ZealanderNicaraguanNigerianNorthern EuropeanNorwegianOkinawanOsageOttawaPaiutePakistaniPalestinianPanamanianParaguayanPennsylvania GermanPeruvianPimaPolishPortuguesePotawatomiPuebloPuerto RicanPuget Sound SalishRomanianRussianSalvadoranSamoanScandinavianScotch-IrishScottishSeminoleSenegaleseSerbianShoshoneSierra LeoneanSiouxSlavicSlovakSloveneSomaliSouth AfricanSouth AmericanSouth American IndianSoviet UnionSpaniardSpanishSpanish AmericanSpanish American IndianSri LankanSubsaharan AfricanSudaneseSwedishSwissSyrianTaiwaneseThaiTlingit-HaidaTohono O'OdhamTonganTrinidadian and TobagonianTsimshianTurkishU.S. Virgin IslanderUgandanUkrainianUruguayanUteVenezuelanVietnameseWelshWest IndianYakamaYaquiYugoslavianYumanYup'ikZimbabwean
Immigration
NonimmigrantsImmigrantsAfghanistanAfricaAlbaniaArgentinaArmeniaAsiaAustraliaAustriaBahamasBangladeshBarbadosBelarusBelgiumBelizeBoliviaBosnia and HerzegovinaBrazilBulgariaBurma/MyanmarCabo VerdeCambodiaCameroonCanadaCaribbeanCentral AmericaChileChinaColombiaCongoCosta RicaCroatiaCubaCzechoslovakiaDenmarkDominicaDominican RepublicEastern AfricaEastern AsiaEastern EuropeEcuadorEgyptEl SalvadorEnglandEritreaEthiopiaEuropeFijiFranceGermanyGhanaGreeceGrenadaGuatemalaGuyanaHaitiHondurasHong KongHungaryIndiaIndonesiaIranIraqIrelandIsraelItalyJamaicaJapanJordanKazakhstanKenyaKoreaKuwaitLaosLatin AmericaLatviaLebanonLiberiaLithuaniaMalaysiaMexicoMicronesiaMiddle AfricaMoldovaMoroccoNepalNetherlandsNicaraguaNigeriaNorth AmericaNorth MacedoniaNorthern AfricaNorthern EuropeNorwayOceaniaPakistanPanamaPeruPhilippinesPolandPortugalRomaniaRussiaSaudi ArabiaScotlandSenegalSerbiaSierra LeoneSingaporeSomaliaSouth AfricaSouth AmericaSouth Central AsiaSouth Eastern AsiaSouthern EuropeSpainSri LankaSt. Vincent and the GrenadinesSudanSwedenSwitzerlandSyriaTaiwanThailandTrinidad and TobagoTurkeyUgandaUkraineUruguayUzbekistanVenezuelaVietnamWest IndiesWestern AfricaWestern AsiaWestern EuropeYemenZaireZimbabweAzores
8th Grade
Income
Poverty
Unemployment
Labor Participation
Family Structure
Vehicle Availability
Education Level
Disability

8th Grade Comparison

Basques

Guatemalans

Exceptional
Tragic
96.1%
8TH GRADE
91.5/ 100
METRIC RATING
135th/ 347
METRIC RANK
91.1%
8TH GRADE
0.0/ 100
METRIC RATING
341st/ 347
METRIC RANK

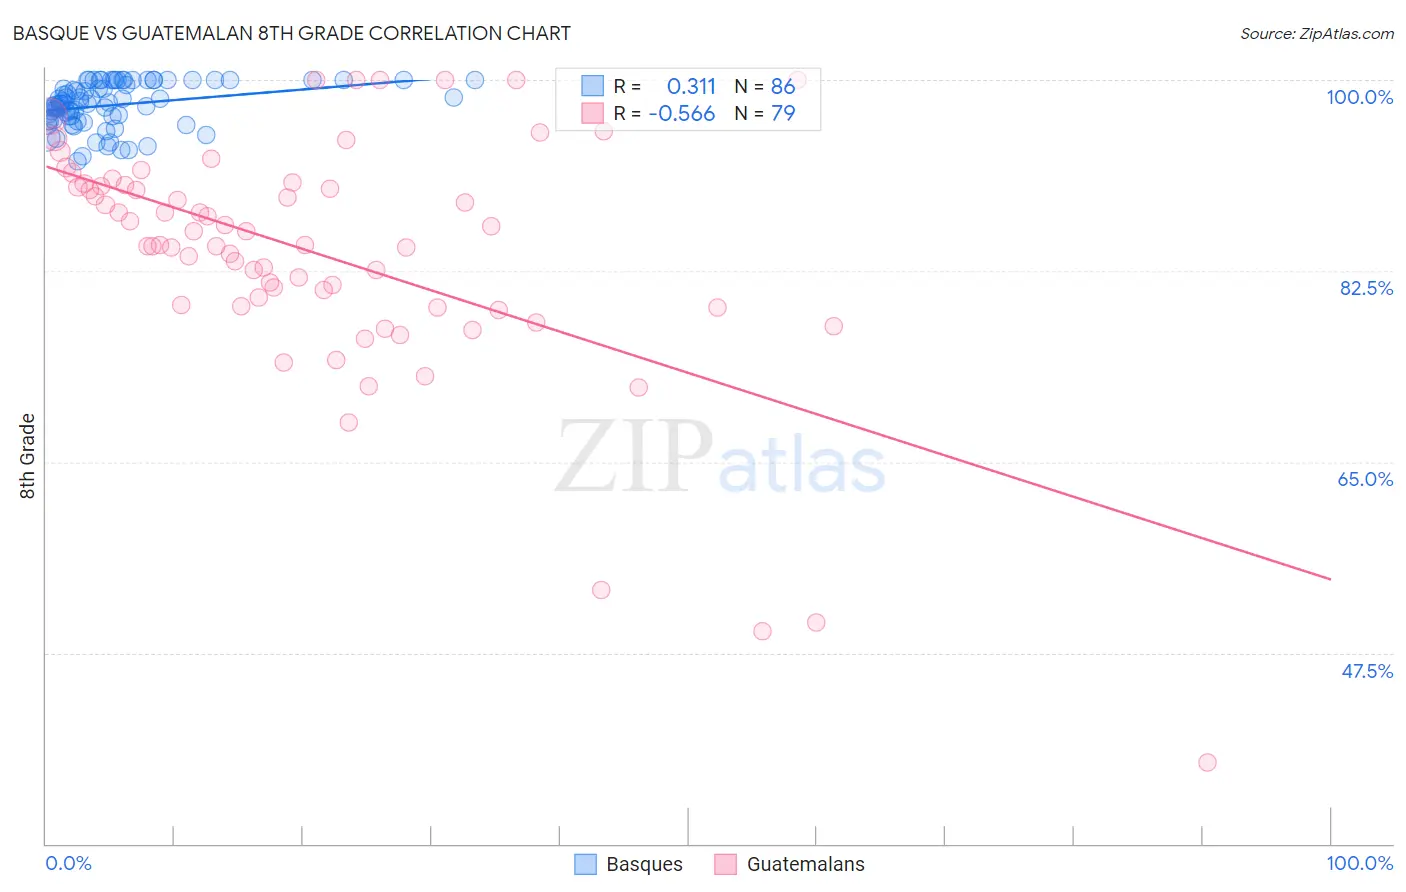
Basque vs Guatemalan 8th Grade Correlation Chart

The statistical analysis conducted on geographies consisting of 165,772,472 people shows a mild positive correlation between the proportion of Basques and percentage of population with at least 8th grade education in the United States with a correlation coefficient (R) of 0.311 and weighted average of 96.1%. Similarly, the statistical analysis conducted on geographies consisting of 409,566,618 people shows a substantial negative correlation between the proportion of Guatemalans and percentage of population with at least 8th grade education in the United States with a correlation coefficient (R) of -0.566 and weighted average of 91.1%, a difference of 5.4%.
Basque vs Guatemalan 8th Grade

8th Grade Correlation Summary

MeasurementBasqueGuatemalan
Minimum92.6%37.5%
Maximum100.0%100.0%
Range7.4%62.5%
Mean97.7%84.1%
Median97.8%84.9%
Interquartile 25% (IQ1)96.3%79.3%
Interquartile 75% (IQ3)100.0%90.4%
Interquartile Range (IQR)3.7%11.1%
Standard Deviation (Sample)2.0%11.2%
Standard Deviation (Population)2.0%11.2%

Similar Demographics by 8th Grade

Demographics Similar to Basques by 8th Grade

In terms of 8th grade, the demographic groups most similar to Basques are Immigrants from Hungary (96.1%, a difference of 0.0%), Jordanian (96.1%, a difference of 0.0%), Immigrants from Kuwait (96.1%, a difference of 0.010%), Immigrants from Turkey (96.1%, a difference of 0.010%), and Pueblo (96.1%, a difference of 0.020%).
DemographicsRating | Rank8th Grade
Immigrants | Bosnia and Herzegovina
93.9
/100
|
#128
Exceptional
96.2%
Cheyenne
93.3
/100
|
#129
Exceptional
96.1%
Soviet Union
92.6
/100
|
#130
Exceptional
96.1%
Pueblo
92.3
/100
|
#131
Exceptional
96.1%
Immigrants | Kuwait
92.2
/100
|
#132
Exceptional
96.1%
Immigrants | Turkey
91.7
/100
|
#133
Exceptional
96.1%
Immigrants | Hungary
91.5
/100
|
#134
Exceptional
96.1%
Basques
91.5
/100
|
#135
Exceptional
96.1%
Jordanians
91.3
/100
|
#136
Exceptional
96.1%
Cambodians
90.6
/100
|
#137
Exceptional
96.1%
Burmese
90.2
/100
|
#138
Exceptional
96.1%
Hmong
89.7
/100
|
#139
Excellent
96.1%
Immigrants | South Central Asia
89.4
/100
|
#140
Excellent
96.1%
Immigrants | Greece
85.9
/100
|
#141
Excellent
96.0%
Immigrants | Eastern Europe
85.4
/100
|
#142
Excellent
96.0%

Demographics Similar to Guatemalans by 8th Grade

In terms of 8th grade, the demographic groups most similar to Guatemalans are Yakama (91.2%, a difference of 0.11%), Mexican (91.4%, a difference of 0.24%), Salvadoran (90.9%, a difference of 0.29%), Immigrants from Guatemala (90.7%, a difference of 0.46%), and Central American (91.6%, a difference of 0.47%).
DemographicsRating | Rank8th Grade
Hispanics or Latinos
0.0
/100
|
#333
Tragic
92.2%
Immigrants | Yemen
0.0
/100
|
#334
Tragic
92.1%
Mexican American Indians
0.0
/100
|
#335
Tragic
92.1%
Immigrants | Honduras
0.0
/100
|
#336
Tragic
91.9%
Immigrants | Latin America
0.0
/100
|
#337
Tragic
91.7%
Central Americans
0.0
/100
|
#338
Tragic
91.6%
Mexicans
0.0
/100
|
#339
Tragic
91.4%
Yakama
0.0
/100
|
#340
Tragic
91.2%
Guatemalans
0.0
/100
|
#341
Tragic
91.1%
Salvadorans
0.0
/100
|
#342
Tragic
90.9%
Immigrants | Guatemala
0.0
/100
|
#343
Tragic
90.7%
Immigrants | Central America
0.0
/100
|
#344
Tragic
90.4%
Immigrants | El Salvador
0.0
/100
|
#345
Tragic
90.3%
Immigrants | Mexico
0.0
/100
|
#346
Tragic
90.2%
Spanish American Indians
0.0
/100
|
#347
Tragic
89.8%