Basque vs African Bachelor's Degree
COMPARE
Basque
African
Bachelor's Degree
Bachelor's Degree Comparison
Basques
Africans
37.7%
BACHELOR'S DEGREE
47.4/ 100
METRIC RATING
177th/ 347
METRIC RANK
32.9%
BACHELOR'S DEGREE
0.5/ 100
METRIC RATING
261st/ 347
METRIC RANK
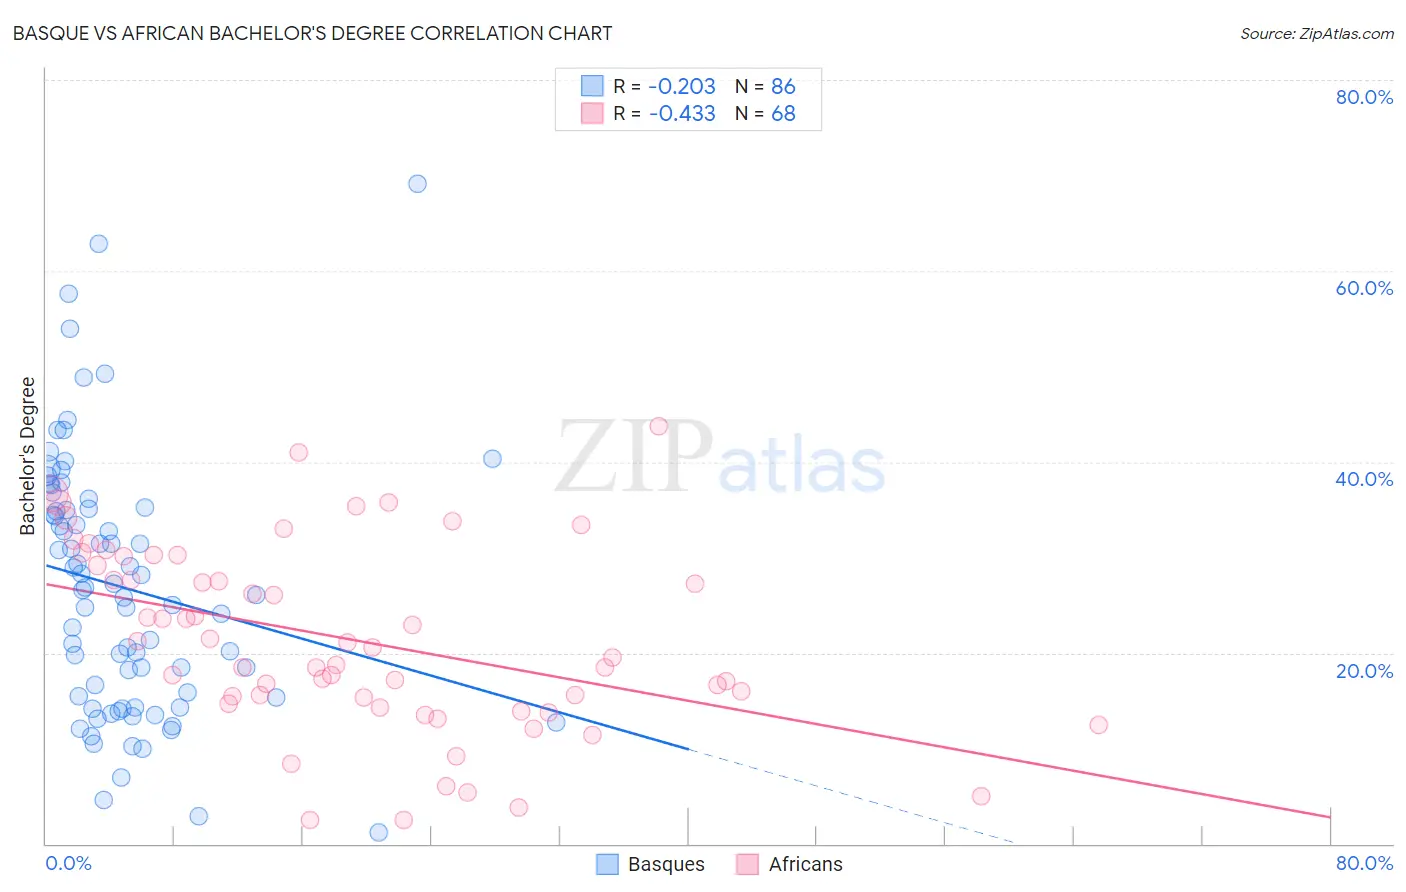
Basque vs African Bachelor's Degree Correlation Chart
The statistical analysis conducted on geographies consisting of 165,778,138 people shows a weak negative correlation between the proportion of Basques and percentage of population with at least bachelor's degree education in the United States with a correlation coefficient (R) of -0.203 and weighted average of 37.7%. Similarly, the statistical analysis conducted on geographies consisting of 470,032,139 people shows a moderate negative correlation between the proportion of Africans and percentage of population with at least bachelor's degree education in the United States with a correlation coefficient (R) of -0.433 and weighted average of 32.9%, a difference of 14.7%.
Bachelor's Degree Correlation Summary
| Measurement | Basque | African |
| Minimum | 1.2% | 2.5% |
| Maximum | 69.2% | 43.7% |
| Range | 68.0% | 41.2% |
| Mean | 26.8% | 21.3% |
| Median | 26.3% | 20.0% |
| Interquartile 25% (IQ1) | 15.4% | 15.0% |
| Interquartile 75% (IQ3) | 35.0% | 29.7% |
| Interquartile Range (IQR) | 19.7% | 14.7% |
| Standard Deviation (Sample) | 13.5% | 9.7% |
| Standard Deviation (Population) | 13.4% | 9.6% |
Similar Demographics by Bachelor's Degree
Demographics Similar to Basques by Bachelor's Degree
In terms of bachelor's degree, the demographic groups most similar to Basques are Costa Rican (37.7%, a difference of 0.020%), Immigrants from Cameroon (37.7%, a difference of 0.060%), Immigrants from Uruguay (37.8%, a difference of 0.090%), Immigrants from Colombia (37.7%, a difference of 0.19%), and Immigrants from Bangladesh (37.8%, a difference of 0.25%).
| Demographics | Rating | Rank | Bachelor's Degree |
| Czechs | 54.4 /100 | #170 | Average 38.0% |
| Bermudans | 54.2 /100 | #171 | Average 38.0% |
| Immigrants | Somalia | 52.8 /100 | #172 | Average 37.9% |
| Immigrants | Iraq | 52.5 /100 | #173 | Average 37.9% |
| Immigrants | Bangladesh | 50.0 /100 | #174 | Average 37.8% |
| Immigrants | Uruguay | 48.3 /100 | #175 | Average 37.8% |
| Costa Ricans | 47.6 /100 | #176 | Average 37.7% |
| Basques | 47.4 /100 | #177 | Average 37.7% |
| Immigrants | Cameroon | 46.8 /100 | #178 | Average 37.7% |
| Immigrants | Colombia | 45.4 /100 | #179 | Average 37.7% |
| Irish | 44.3 /100 | #180 | Average 37.6% |
| Immigrants | Senegal | 43.8 /100 | #181 | Average 37.6% |
| Immigrants | Bosnia and Herzegovina | 43.4 /100 | #182 | Average 37.6% |
| Senegalese | 42.2 /100 | #183 | Average 37.5% |
| Scandinavians | 41.7 /100 | #184 | Average 37.5% |
Demographics Similar to Africans by Bachelor's Degree
In terms of bachelor's degree, the demographic groups most similar to Africans are Immigrants from Jamaica (32.9%, a difference of 0.0%), Malaysian (32.9%, a difference of 0.090%), Belizean (32.8%, a difference of 0.29%), Osage (33.0%, a difference of 0.45%), and French American Indian (33.1%, a difference of 0.50%).
| Demographics | Rating | Rank | Bachelor's Degree |
| Native Hawaiians | 0.7 /100 | #254 | Tragic 33.2% |
| Iroquois | 0.7 /100 | #255 | Tragic 33.2% |
| Nicaraguans | 0.6 /100 | #256 | Tragic 33.1% |
| Spanish Americans | 0.6 /100 | #257 | Tragic 33.1% |
| French American Indians | 0.6 /100 | #258 | Tragic 33.1% |
| Osage | 0.5 /100 | #259 | Tragic 33.0% |
| Malaysians | 0.5 /100 | #260 | Tragic 32.9% |
| Africans | 0.5 /100 | #261 | Tragic 32.9% |
| Immigrants | Jamaica | 0.5 /100 | #262 | Tragic 32.9% |
| Belizeans | 0.4 /100 | #263 | Tragic 32.8% |
| Central American Indians | 0.3 /100 | #264 | Tragic 32.5% |
| Bahamians | 0.3 /100 | #265 | Tragic 32.5% |
| Immigrants | Dominica | 0.3 /100 | #266 | Tragic 32.5% |
| Cubans | 0.3 /100 | #267 | Tragic 32.5% |
| Immigrants | Portugal | 0.2 /100 | #268 | Tragic 32.2% |