Bangladeshi vs Immigrants from Ireland 8th Grade
COMPARE
Bangladeshi
Immigrants from Ireland
8th Grade
8th Grade Comparison
Bangladeshis
Immigrants from Ireland
94.3%
8TH GRADE
0.0/ 100
METRIC RATING
292nd/ 347
METRIC RANK
96.5%
8TH GRADE
99.5/ 100
METRIC RATING
74th/ 347
METRIC RANK
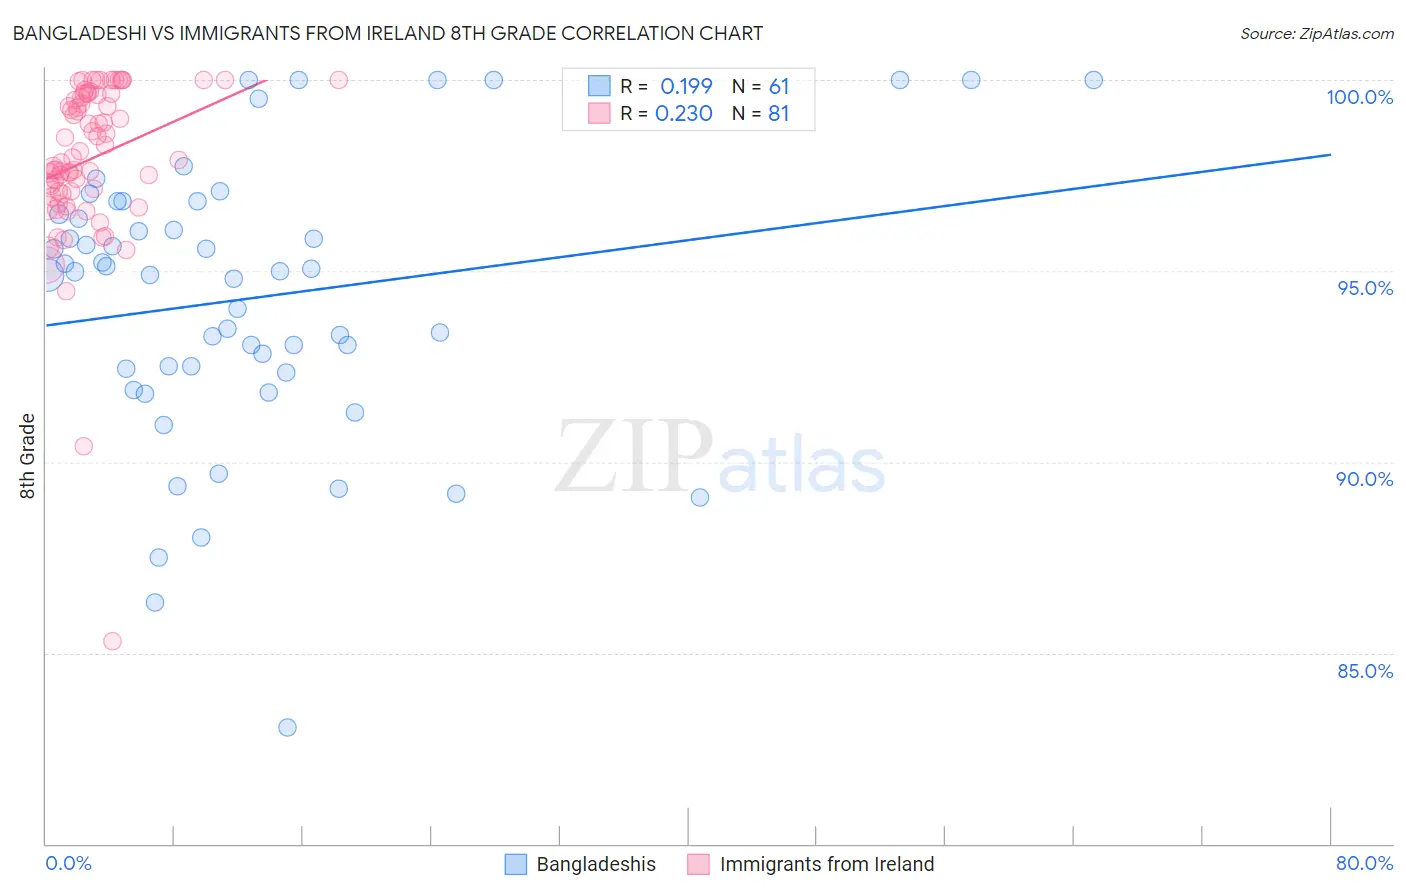
Bangladeshi vs Immigrants from Ireland 8th Grade Correlation Chart
The statistical analysis conducted on geographies consisting of 141,430,495 people shows a poor positive correlation between the proportion of Bangladeshis and percentage of population with at least 8th grade education in the United States with a correlation coefficient (R) of 0.199 and weighted average of 94.3%. Similarly, the statistical analysis conducted on geographies consisting of 240,784,498 people shows a weak positive correlation between the proportion of Immigrants from Ireland and percentage of population with at least 8th grade education in the United States with a correlation coefficient (R) of 0.230 and weighted average of 96.5%, a difference of 2.4%.
8th Grade Correlation Summary
| Measurement | Bangladeshi | Immigrants from Ireland |
| Minimum | 83.1% | 85.3% |
| Maximum | 100.0% | 100.0% |
| Range | 16.9% | 14.7% |
| Mean | 94.3% | 97.9% |
| Median | 95.0% | 98.0% |
| Interquartile 25% (IQ1) | 92.4% | 97.1% |
| Interquartile 75% (IQ3) | 96.6% | 99.6% |
| Interquartile Range (IQR) | 4.3% | 2.6% |
| Standard Deviation (Sample) | 3.7% | 2.2% |
| Standard Deviation (Population) | 3.6% | 2.2% |
Similar Demographics by 8th Grade
Demographics Similar to Bangladeshis by 8th Grade
In terms of 8th grade, the demographic groups most similar to Bangladeshis are Yaqui (94.2%, a difference of 0.030%), Houma (94.2%, a difference of 0.030%), Fijian (94.2%, a difference of 0.040%), Immigrants from Grenada (94.3%, a difference of 0.070%), and Haitian (94.2%, a difference of 0.070%).
| Demographics | Rating | Rank | 8th Grade |
| Immigrants | Barbados | 0.0 /100 | #285 | Tragic 94.5% |
| Immigrants | Peru | 0.0 /100 | #286 | Tragic 94.5% |
| Tohono O'odham | 0.0 /100 | #287 | Tragic 94.5% |
| Malaysians | 0.0 /100 | #288 | Tragic 94.5% |
| British West Indians | 0.0 /100 | #289 | Tragic 94.4% |
| Immigrants | West Indies | 0.0 /100 | #290 | Tragic 94.3% |
| Immigrants | Grenada | 0.0 /100 | #291 | Tragic 94.3% |
| Bangladeshis | 0.0 /100 | #292 | Tragic 94.3% |
| Yaqui | 0.0 /100 | #293 | Tragic 94.2% |
| Houma | 0.0 /100 | #294 | Tragic 94.2% |
| Fijians | 0.0 /100 | #295 | Tragic 94.2% |
| Haitians | 0.0 /100 | #296 | Tragic 94.2% |
| Immigrants | South Eastern Asia | 0.0 /100 | #297 | Tragic 94.2% |
| Indonesians | 0.0 /100 | #298 | Tragic 94.1% |
| Cubans | 0.0 /100 | #299 | Tragic 94.1% |
Demographics Similar to Immigrants from Ireland by 8th Grade
In terms of 8th grade, the demographic groups most similar to Immigrants from Ireland are New Zealander (96.6%, a difference of 0.010%), Immigrants from England (96.6%, a difference of 0.010%), Arapaho (96.6%, a difference of 0.010%), Zimbabwean (96.5%, a difference of 0.010%), and Immigrants from Netherlands (96.5%, a difference of 0.010%).
| Demographics | Rating | Rank | 8th Grade |
| Iranians | 99.7 /100 | #67 | Exceptional 96.6% |
| Creek | 99.7 /100 | #68 | Exceptional 96.6% |
| Americans | 99.7 /100 | #69 | Exceptional 96.6% |
| Immigrants | Lithuania | 99.6 /100 | #70 | Exceptional 96.6% |
| New Zealanders | 99.5 /100 | #71 | Exceptional 96.6% |
| Immigrants | England | 99.5 /100 | #72 | Exceptional 96.6% |
| Arapaho | 99.5 /100 | #73 | Exceptional 96.6% |
| Immigrants | Ireland | 99.5 /100 | #74 | Exceptional 96.5% |
| Zimbabweans | 99.4 /100 | #75 | Exceptional 96.5% |
| Immigrants | Netherlands | 99.4 /100 | #76 | Exceptional 96.5% |
| Cypriots | 99.4 /100 | #77 | Exceptional 96.5% |
| Yugoslavians | 99.4 /100 | #78 | Exceptional 96.5% |
| Puget Sound Salish | 99.3 /100 | #79 | Exceptional 96.5% |
| Delaware | 99.2 /100 | #80 | Exceptional 96.5% |
| Romanians | 99.2 /100 | #81 | Exceptional 96.5% |