Bangladeshi vs Immigrants from India Kindergarten

COMPARE

Bangladeshi
Race
Ancestry
AfghanAfricanAlaska NativeAlaskan AthabascanAlbanianAleutAlsatianAmericanApacheArabArapahoArgentineanArmenianAssyrian/Chaldean/SyriacAustralianAustrianBahamianBangladeshiBarbadianBasqueBelgianBelizeanBermudanBhutaneseBlackfeetBolivianBrazilianBritishBritish West IndianBulgarianBurmeseCajunCambodianCanadianCape VerdeanCarpatho RusynCelticCentral AmericanCentral American IndianCherokeeCheyenneChickasawChileanChineseChippewaChoctawColombianColvilleComancheCosta RicanCreeCreekCroatianCrowCubanCypriotCzechCzechoslovakianDanishDelawareDominicanDutchDutch West IndianEastern EuropeanEcuadorianEgyptianEnglishEstonianEthiopianEuropeanFijianFilipinoFinnishFrenchFrench American IndianFrench CanadianGermanGerman RussianGhanaianGreekGuamanian/ChamorroGuatemalanGuyaneseHaitianHmongHonduranHopiHoumaHungarianIcelanderIndian (Asian)IndonesianInupiatIranianIraqiIrishIroquoisIsraeliItalianJamaicanJapaneseJordanianKenyanKiowaKoreanLaotianLatvianLebaneseLiberianLithuanianLumbeeLuxembourgerMacedonianMalaysianMalteseMarshalleseMenomineeMexicanMexican American IndianMongolianMoroccanNative HawaiianNavajoNepaleseNew ZealanderNicaraguanNigerianNorthern EuropeanNorwegianOkinawanOsageOttawaPaiutePakistaniPalestinianPanamanianParaguayanPennsylvania GermanPeruvianPimaPolishPortuguesePotawatomiPuebloPuerto RicanPuget Sound SalishRomanianRussianSalvadoranSamoanScandinavianScotch-IrishScottishSeminoleSenegaleseSerbianShoshoneSierra LeoneanSiouxSlavicSlovakSloveneSomaliSouth AfricanSouth AmericanSouth American IndianSoviet UnionSpaniardSpanishSpanish AmericanSpanish American IndianSri LankanSubsaharan AfricanSudaneseSwedishSwissSyrianTaiwaneseThaiTlingit-HaidaTohono O'OdhamTonganTrinidadian and TobagonianTsimshianTurkishU.S. Virgin IslanderUgandanUkrainianUruguayanUteVenezuelanVietnameseWelshWest IndianYakamaYaquiYugoslavianYumanYup'ikZimbabwean
Immigration
NonimmigrantsImmigrantsAfghanistanAfricaAlbaniaArgentinaArmeniaAsiaAustraliaAustriaBahamasBangladeshBarbadosBelarusBelgiumBelizeBoliviaBosnia and HerzegovinaBrazilBulgariaBurma/MyanmarCabo VerdeCambodiaCameroonCanadaCaribbeanCentral AmericaChileChinaColombiaCongoCosta RicaCroatiaCubaCzechoslovakiaDenmarkDominicaDominican RepublicEastern AfricaEastern AsiaEastern EuropeEcuadorEgyptEl SalvadorEnglandEritreaEthiopiaEuropeFijiFranceGermanyGhanaGreeceGrenadaGuatemalaGuyanaHaitiHondurasHong KongHungaryIndonesiaIranIraqIrelandIsraelItalyJamaicaJapanJordanKazakhstanKenyaKoreaKuwaitLaosLatin AmericaLatviaLebanonLiberiaLithuaniaMalaysiaMexicoMicronesiaMiddle AfricaMoldovaMoroccoNepalNetherlandsNicaraguaNigeriaNorth AmericaNorth MacedoniaNorthern AfricaNorthern EuropeNorwayOceaniaPakistanPanamaPeruPhilippinesPolandPortugalRomaniaRussiaSaudi ArabiaScotlandSenegalSerbiaSierra LeoneSingaporeSomaliaSouth AfricaSouth AmericaSouth Central AsiaSouth Eastern AsiaSouthern EuropeSpainSri LankaSt. Vincent and the GrenadinesSudanSwedenSwitzerlandSyriaTaiwanThailandTrinidad and TobagoTurkeyUgandaUkraineUruguayUzbekistanVenezuelaVietnamWest IndiesWestern AfricaWestern AsiaWestern EuropeYemenZaireZimbabweAzores
Immigrants from India
Race
Ancestry
AfghanAfricanAlaska NativeAlaskan AthabascanAlbanianAleutAlsatianAmericanApacheArabArapahoArgentineanArmenianAssyrian/Chaldean/SyriacAustralianAustrianBahamianBarbadianBasqueBelgianBelizeanBermudanBhutaneseBlackfeetBolivianBrazilianBritishBritish West IndianBulgarianBurmeseCajunCambodianCanadianCape VerdeanCarpatho RusynCelticCentral AmericanCentral American IndianCherokeeCheyenneChickasawChileanChineseChippewaChoctawColombianColvilleComancheCosta RicanCreeCreekCroatianCrowCubanCypriotCzechCzechoslovakianDanishDelawareDominicanDutchDutch West IndianEastern EuropeanEcuadorianEgyptianEnglishEstonianEthiopianEuropeanFijianFilipinoFinnishFrenchFrench American IndianFrench CanadianGermanGerman RussianGhanaianGreekGuamanian/ChamorroGuatemalanGuyaneseHaitianHmongHonduranHopiHoumaHungarianIcelanderIndian (Asian)IndonesianInupiatIranianIraqiIrishIroquoisIsraeliItalianJamaicanJapaneseJordanianKenyanKiowaKoreanLaotianLatvianLebaneseLiberianLithuanianLumbeeLuxembourgerMacedonianMalaysianMalteseMarshalleseMenomineeMexicanMexican American IndianMongolianMoroccanNative HawaiianNavajoNepaleseNew ZealanderNicaraguanNigerianNorthern EuropeanNorwegianOkinawanOsageOttawaPaiutePakistaniPalestinianPanamanianParaguayanPennsylvania GermanPeruvianPimaPolishPortuguesePotawatomiPuebloPuerto RicanPuget Sound SalishRomanianRussianSalvadoranSamoanScandinavianScotch-IrishScottishSeminoleSenegaleseSerbianShoshoneSierra LeoneanSiouxSlavicSlovakSloveneSomaliSouth AfricanSouth AmericanSouth American IndianSoviet UnionSpaniardSpanishSpanish AmericanSpanish American IndianSri LankanSubsaharan AfricanSudaneseSwedishSwissSyrianTaiwaneseThaiTlingit-HaidaTohono O'OdhamTonganTrinidadian and TobagonianTsimshianTurkishU.S. Virgin IslanderUgandanUkrainianUruguayanUteVenezuelanVietnameseWelshWest IndianYakamaYaquiYugoslavianYumanYup'ikZimbabwean
Immigration
NonimmigrantsImmigrantsAfghanistanAfricaAlbaniaArgentinaArmeniaAsiaAustraliaAustriaBahamasBangladeshBarbadosBelarusBelgiumBelizeBoliviaBosnia and HerzegovinaBrazilBulgariaBurma/MyanmarCabo VerdeCambodiaCameroonCanadaCaribbeanCentral AmericaChileChinaColombiaCongoCosta RicaCroatiaCubaCzechoslovakiaDenmarkDominicaDominican RepublicEastern AfricaEastern AsiaEastern EuropeEcuadorEgyptEl SalvadorEnglandEritreaEthiopiaEuropeFijiFranceGermanyGhanaGreeceGrenadaGuatemalaGuyanaHaitiHondurasHong KongHungaryIndiaIndonesiaIranIraqIrelandIsraelItalyJamaicaJapanJordanKazakhstanKenyaKoreaKuwaitLaosLatin AmericaLatviaLebanonLiberiaLithuaniaMalaysiaMexicoMicronesiaMiddle AfricaMoldovaMoroccoNepalNetherlandsNicaraguaNigeriaNorth AmericaNorth MacedoniaNorthern AfricaNorthern EuropeNorwayOceaniaPakistanPanamaPeruPhilippinesPolandPortugalRomaniaRussiaSaudi ArabiaScotlandSenegalSerbiaSierra LeoneSingaporeSomaliaSouth AfricaSouth AmericaSouth Central AsiaSouth Eastern AsiaSouthern EuropeSpainSri LankaSt. Vincent and the GrenadinesSudanSwedenSwitzerlandSyriaTaiwanThailandTrinidad and TobagoTurkeyUgandaUkraineUruguayUzbekistanVenezuelaVietnamWest IndiesWestern AfricaWestern AsiaWestern EuropeYemenZaireZimbabweAzores
Kindergarten
Income
Poverty
Unemployment
Labor Participation
Family Structure
Vehicle Availability
Education Level
Disability

Kindergarten Comparison

Bangladeshis

Immigrants from India

Tragic
Exceptional
96.6%
KINDERGARTEN
0.0/ 100
METRIC RATING
335th/ 347
METRIC RANK
98.3%
KINDERGARTEN
98.6/ 100
METRIC RATING
93rd/ 347
METRIC RANK

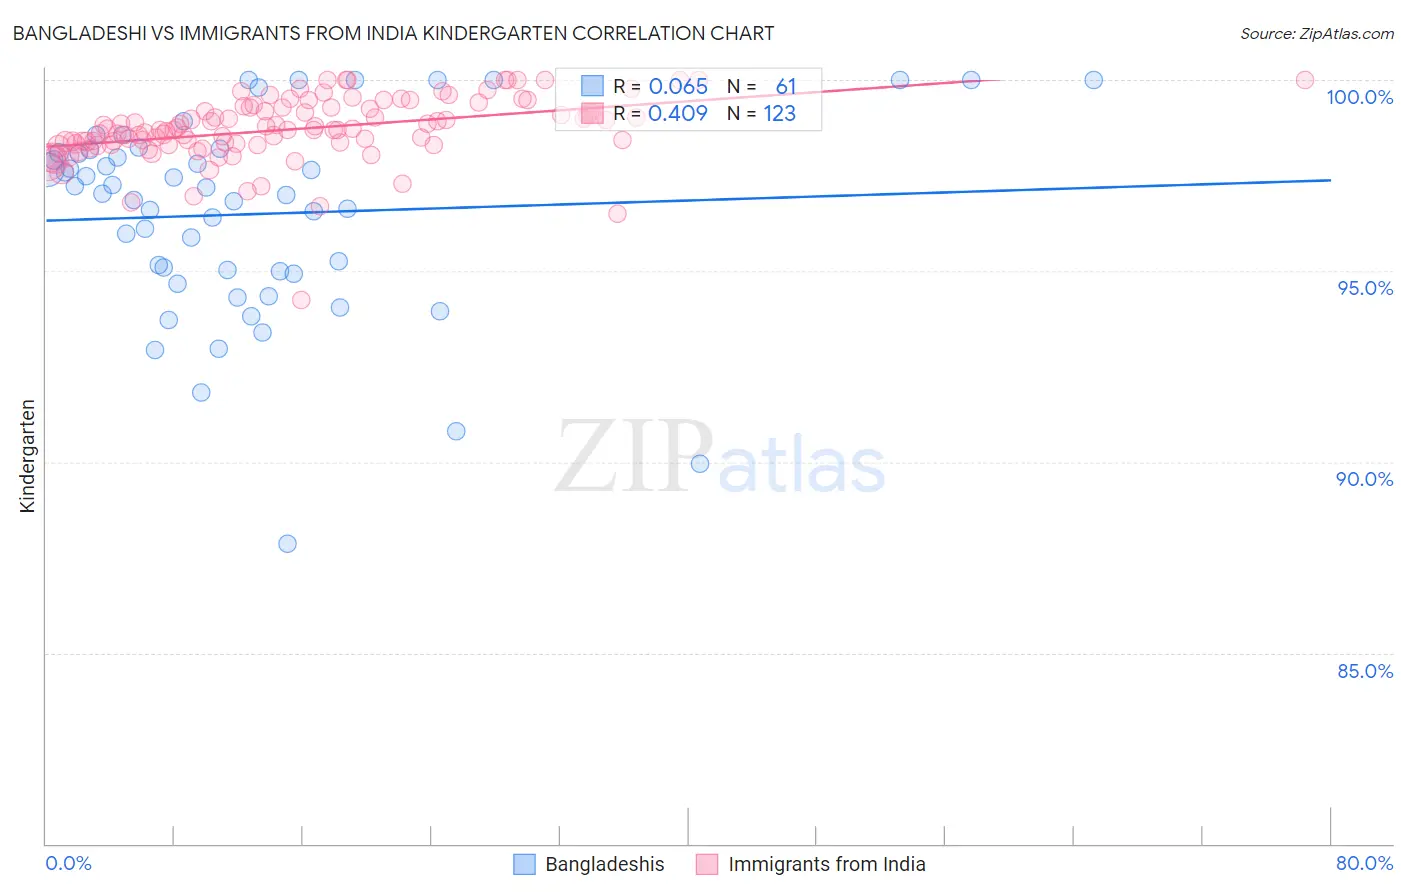
Bangladeshi vs Immigrants from India Kindergarten Correlation Chart

The statistical analysis conducted on geographies consisting of 141,430,495 people shows a slight positive correlation between the proportion of Bangladeshis and percentage of population with at least kindergarten education in the United States with a correlation coefficient (R) of 0.065 and weighted average of 96.6%. Similarly, the statistical analysis conducted on geographies consisting of 434,105,844 people shows a moderate positive correlation between the proportion of Immigrants from India and percentage of population with at least kindergarten education in the United States with a correlation coefficient (R) of 0.409 and weighted average of 98.3%, a difference of 1.8%.
Bangladeshi vs Immigrants from India Kindergarten

Kindergarten Correlation Summary

MeasurementBangladeshiImmigrants from India
Minimum87.9%94.2%
Maximum100.0%100.0%
Range12.1%5.8%
Mean96.5%98.7%
Median97.0%98.7%
Interquartile 25% (IQ1)95.0%98.3%
Interquartile 75% (IQ3)98.1%99.3%
Interquartile Range (IQR)3.2%0.97%
Standard Deviation (Sample)2.6%0.85%
Standard Deviation (Population)2.6%0.85%

Similar Demographics by Kindergarten

Demographics Similar to Bangladeshis by Kindergarten

In terms of kindergarten, the demographic groups most similar to Bangladeshis are Immigrants from Dominican Republic (96.6%, a difference of 0.0%), Central American (96.6%, a difference of 0.030%), Guatemalan (96.5%, a difference of 0.030%), Yakama (96.6%, a difference of 0.050%), and Immigrants from Armenia (96.6%, a difference of 0.070%).
DemographicsRating | RankKindergarten
Immigrants | Latin America
0.0
/100
|
#328
Tragic
96.7%
Immigrants | Vietnam
0.0
/100
|
#329
Tragic
96.7%
Japanese
0.0
/100
|
#330
Tragic
96.7%
Immigrants | Armenia
0.0
/100
|
#331
Tragic
96.6%
Yakama
0.0
/100
|
#332
Tragic
96.6%
Central Americans
0.0
/100
|
#333
Tragic
96.6%
Immigrants | Dominican Republic
0.0
/100
|
#334
Tragic
96.6%
Bangladeshis
0.0
/100
|
#335
Tragic
96.6%
Guatemalans
0.0
/100
|
#336
Tragic
96.5%
Immigrants | Cambodia
0.0
/100
|
#337
Tragic
96.5%
Immigrants | Fiji
0.0
/100
|
#338
Tragic
96.5%
Immigrants | Guatemala
0.0
/100
|
#339
Tragic
96.4%
Immigrants | Central America
0.0
/100
|
#340
Tragic
96.4%
Immigrants | Cabo Verde
0.0
/100
|
#341
Tragic
96.4%
Immigrants | Mexico
0.0
/100
|
#342
Tragic
96.4%

Demographics Similar to Immigrants from India by Kindergarten

In terms of kindergarten, the demographic groups most similar to Immigrants from India are South African (98.3%, a difference of 0.0%), Ukrainian (98.3%, a difference of 0.010%), Immigrants from South Africa (98.3%, a difference of 0.010%), Zimbabwean (98.3%, a difference of 0.010%), and Immigrants from Western Europe (98.3%, a difference of 0.010%).
DemographicsRating | RankKindergarten
Hopi
99.0
/100
|
#86
Exceptional
98.3%
Immigrants | Australia
99.0
/100
|
#87
Exceptional
98.3%
Ukrainians
98.8
/100
|
#88
Exceptional
98.3%
Immigrants | South Africa
98.8
/100
|
#89
Exceptional
98.3%
Zimbabweans
98.8
/100
|
#90
Exceptional
98.3%
Immigrants | Western Europe
98.8
/100
|
#91
Exceptional
98.3%
Macedonians
98.7
/100
|
#92
Exceptional
98.3%
Immigrants | India
98.6
/100
|
#93
Exceptional
98.3%
South Africans
98.5
/100
|
#94
Exceptional
98.3%
Immigrants | Germany
98.5
/100
|
#95
Exceptional
98.3%
Immigrants | Nonimmigrants
98.3
/100
|
#96
Exceptional
98.3%
Cypriots
98.3
/100
|
#97
Exceptional
98.3%
Choctaw
98.2
/100
|
#98
Exceptional
98.3%
Colville
98.2
/100
|
#99
Exceptional
98.3%
Puget Sound Salish
98.1
/100
|
#100
Exceptional
98.2%