Bangladeshi vs Immigrants from Bulgaria 7th Grade

COMPARE

Bangladeshi
Race
Ancestry
AfghanAfricanAlaska NativeAlaskan AthabascanAlbanianAleutAlsatianAmericanApacheArabArapahoArgentineanArmenianAssyrian/Chaldean/SyriacAustralianAustrianBahamianBangladeshiBarbadianBasqueBelgianBelizeanBermudanBhutaneseBlackfeetBolivianBrazilianBritishBritish West IndianBulgarianBurmeseCajunCambodianCanadianCape VerdeanCarpatho RusynCelticCentral AmericanCentral American IndianCherokeeCheyenneChickasawChileanChineseChippewaChoctawColombianColvilleComancheCosta RicanCreeCreekCroatianCrowCubanCypriotCzechCzechoslovakianDanishDelawareDominicanDutchDutch West IndianEastern EuropeanEcuadorianEgyptianEnglishEstonianEthiopianEuropeanFijianFilipinoFinnishFrenchFrench American IndianFrench CanadianGermanGerman RussianGhanaianGreekGuamanian/ChamorroGuatemalanGuyaneseHaitianHmongHonduranHopiHoumaHungarianIcelanderIndian (Asian)IndonesianInupiatIranianIraqiIrishIroquoisIsraeliItalianJamaicanJapaneseJordanianKenyanKiowaKoreanLaotianLatvianLebaneseLiberianLithuanianLumbeeLuxembourgerMacedonianMalaysianMalteseMarshalleseMenomineeMexicanMexican American IndianMongolianMoroccanNative HawaiianNavajoNepaleseNew ZealanderNicaraguanNigerianNorthern EuropeanNorwegianOkinawanOsageOttawaPaiutePakistaniPalestinianPanamanianParaguayanPennsylvania GermanPeruvianPimaPolishPortuguesePotawatomiPuebloPuerto RicanPuget Sound SalishRomanianRussianSalvadoranSamoanScandinavianScotch-IrishScottishSeminoleSenegaleseSerbianShoshoneSierra LeoneanSiouxSlavicSlovakSloveneSomaliSouth AfricanSouth AmericanSouth American IndianSoviet UnionSpaniardSpanishSpanish AmericanSpanish American IndianSri LankanSubsaharan AfricanSudaneseSwedishSwissSyrianTaiwaneseThaiTlingit-HaidaTohono O'OdhamTonganTrinidadian and TobagonianTsimshianTurkishU.S. Virgin IslanderUgandanUkrainianUruguayanUteVenezuelanVietnameseWelshWest IndianYakamaYaquiYugoslavianYumanYup'ikZimbabwean
Immigration
NonimmigrantsImmigrantsAfghanistanAfricaAlbaniaArgentinaArmeniaAsiaAustraliaAustriaBahamasBangladeshBarbadosBelarusBelgiumBelizeBoliviaBosnia and HerzegovinaBrazilBurma/MyanmarCabo VerdeCambodiaCameroonCanadaCaribbeanCentral AmericaChileChinaColombiaCongoCosta RicaCroatiaCubaCzechoslovakiaDenmarkDominicaDominican RepublicEastern AfricaEastern AsiaEastern EuropeEcuadorEgyptEl SalvadorEnglandEritreaEthiopiaEuropeFijiFranceGermanyGhanaGreeceGrenadaGuatemalaGuyanaHaitiHondurasHong KongHungaryIndiaIndonesiaIranIraqIrelandIsraelItalyJamaicaJapanJordanKazakhstanKenyaKoreaKuwaitLaosLatin AmericaLatviaLebanonLiberiaLithuaniaMalaysiaMexicoMicronesiaMiddle AfricaMoldovaMoroccoNepalNetherlandsNicaraguaNigeriaNorth AmericaNorth MacedoniaNorthern AfricaNorthern EuropeNorwayOceaniaPakistanPanamaPeruPhilippinesPolandPortugalRomaniaRussiaSaudi ArabiaScotlandSenegalSerbiaSierra LeoneSingaporeSomaliaSouth AfricaSouth AmericaSouth Central AsiaSouth Eastern AsiaSouthern EuropeSpainSri LankaSt. Vincent and the GrenadinesSudanSwedenSwitzerlandSyriaTaiwanThailandTrinidad and TobagoTurkeyUgandaUkraineUruguayUzbekistanVenezuelaVietnamWest IndiesWestern AfricaWestern AsiaWestern EuropeYemenZaireZimbabweAzores
Immigrants from Bulgaria
Race
Ancestry
AfghanAfricanAlaska NativeAlaskan AthabascanAlbanianAleutAlsatianAmericanApacheArabArapahoArgentineanArmenianAssyrian/Chaldean/SyriacAustralianAustrianBahamianBarbadianBasqueBelgianBelizeanBermudanBhutaneseBlackfeetBolivianBrazilianBritishBritish West IndianBulgarianBurmeseCajunCambodianCanadianCape VerdeanCarpatho RusynCelticCentral AmericanCentral American IndianCherokeeCheyenneChickasawChileanChineseChippewaChoctawColombianColvilleComancheCosta RicanCreeCreekCroatianCrowCubanCypriotCzechCzechoslovakianDanishDelawareDominicanDutchDutch West IndianEastern EuropeanEcuadorianEgyptianEnglishEstonianEthiopianEuropeanFijianFilipinoFinnishFrenchFrench American IndianFrench CanadianGermanGerman RussianGhanaianGreekGuamanian/ChamorroGuatemalanGuyaneseHaitianHmongHonduranHopiHoumaHungarianIcelanderIndian (Asian)IndonesianInupiatIranianIraqiIrishIroquoisIsraeliItalianJamaicanJapaneseJordanianKenyanKiowaKoreanLaotianLatvianLebaneseLiberianLithuanianLumbeeLuxembourgerMacedonianMalaysianMalteseMarshalleseMenomineeMexicanMexican American IndianMongolianMoroccanNative HawaiianNavajoNepaleseNew ZealanderNicaraguanNigerianNorthern EuropeanNorwegianOkinawanOsageOttawaPaiutePakistaniPalestinianPanamanianParaguayanPennsylvania GermanPeruvianPimaPolishPortuguesePotawatomiPuebloPuerto RicanPuget Sound SalishRomanianRussianSalvadoranSamoanScandinavianScotch-IrishScottishSeminoleSenegaleseSerbianShoshoneSierra LeoneanSiouxSlavicSlovakSloveneSomaliSouth AfricanSouth AmericanSouth American IndianSoviet UnionSpaniardSpanishSpanish AmericanSpanish American IndianSri LankanSubsaharan AfricanSudaneseSwedishSwissSyrianTaiwaneseThaiTlingit-HaidaTohono O'OdhamTonganTrinidadian and TobagonianTsimshianTurkishU.S. Virgin IslanderUgandanUkrainianUruguayanUteVenezuelanVietnameseWelshWest IndianYakamaYaquiYugoslavianYumanYup'ikZimbabwean
Immigration
NonimmigrantsImmigrantsAfghanistanAfricaAlbaniaArgentinaArmeniaAsiaAustraliaAustriaBahamasBangladeshBarbadosBelarusBelgiumBelizeBoliviaBosnia and HerzegovinaBrazilBulgariaBurma/MyanmarCabo VerdeCambodiaCameroonCanadaCaribbeanCentral AmericaChileChinaColombiaCongoCosta RicaCroatiaCubaCzechoslovakiaDenmarkDominicaDominican RepublicEastern AfricaEastern AsiaEastern EuropeEcuadorEgyptEl SalvadorEnglandEritreaEthiopiaEuropeFijiFranceGermanyGhanaGreeceGrenadaGuatemalaGuyanaHaitiHondurasHong KongHungaryIndiaIndonesiaIranIraqIrelandIsraelItalyJamaicaJapanJordanKazakhstanKenyaKoreaKuwaitLaosLatin AmericaLatviaLebanonLiberiaLithuaniaMalaysiaMexicoMicronesiaMiddle AfricaMoldovaMoroccoNepalNetherlandsNicaraguaNigeriaNorth AmericaNorth MacedoniaNorthern AfricaNorthern EuropeNorwayOceaniaPakistanPanamaPeruPhilippinesPolandPortugalRomaniaRussiaSaudi ArabiaScotlandSenegalSerbiaSierra LeoneSingaporeSomaliaSouth AfricaSouth AmericaSouth Central AsiaSouth Eastern AsiaSouthern EuropeSpainSri LankaSt. Vincent and the GrenadinesSudanSwedenSwitzerlandSyriaTaiwanThailandTrinidad and TobagoTurkeyUgandaUkraineUruguayUzbekistanVenezuelaVietnamWest IndiesWestern AfricaWestern AsiaWestern EuropeYemenZaireZimbabweAzores
7th Grade
Income
Poverty
Unemployment
Labor Participation
Family Structure
Vehicle Availability
Education Level
Disability

7th Grade Comparison

Bangladeshis

Immigrants from Bulgaria

Tragic
Exceptional
94.5%
7TH GRADE
0.0/ 100
METRIC RATING
299th/ 347
METRIC RANK
96.4%
7TH GRADE
94.0/ 100
METRIC RATING
125th/ 347
METRIC RANK

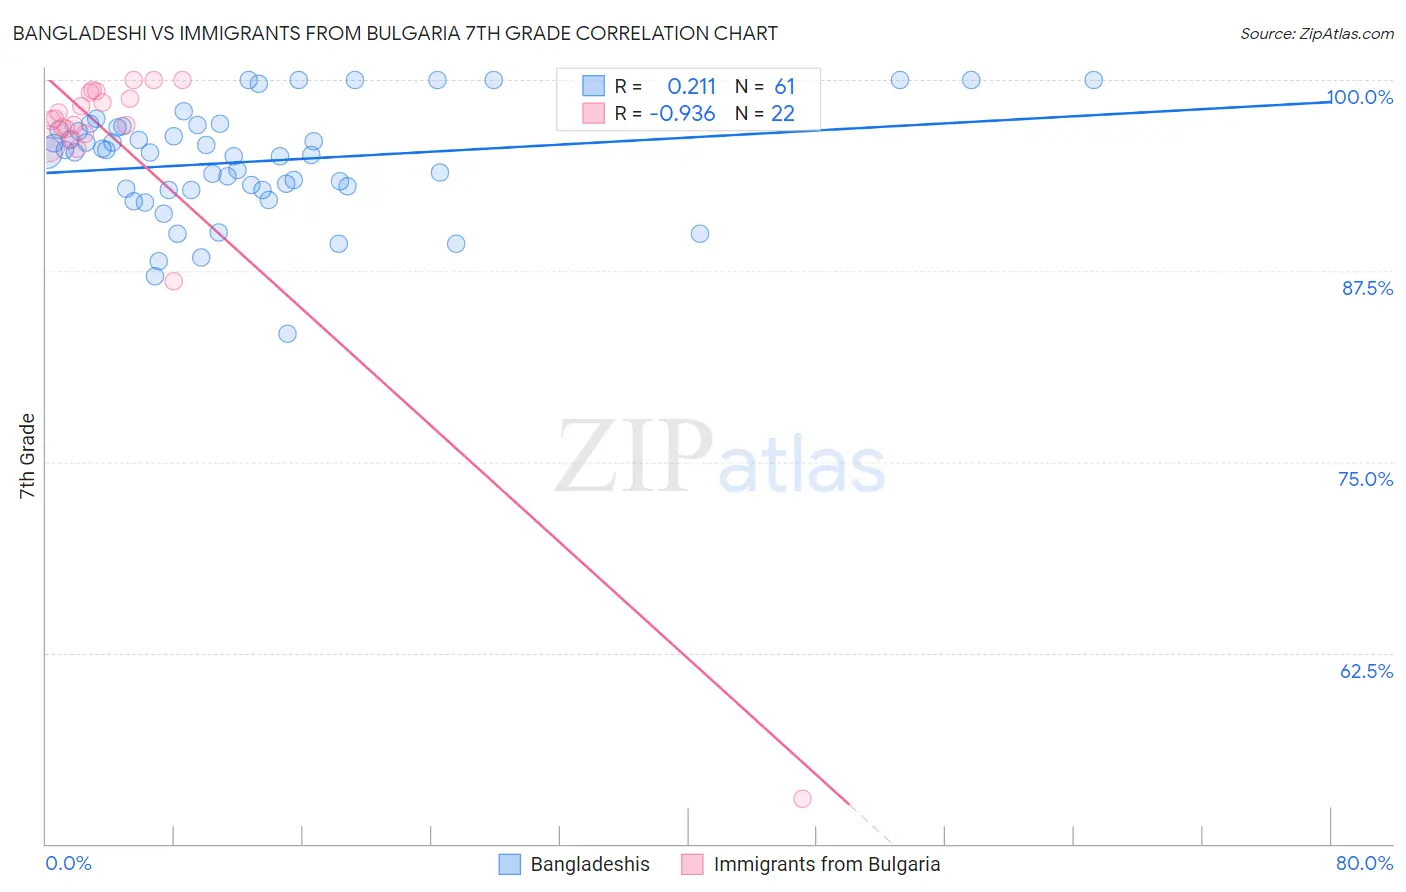
Bangladeshi vs Immigrants from Bulgaria 7th Grade Correlation Chart

The statistical analysis conducted on geographies consisting of 141,430,495 people shows a weak positive correlation between the proportion of Bangladeshis and percentage of population with at least 7th grade education in the United States with a correlation coefficient (R) of 0.211 and weighted average of 94.5%. Similarly, the statistical analysis conducted on geographies consisting of 172,552,181 people shows a near-perfect negative correlation between the proportion of Immigrants from Bulgaria and percentage of population with at least 7th grade education in the United States with a correlation coefficient (R) of -0.936 and weighted average of 96.4%, a difference of 2.0%.
Bangladeshi vs Immigrants from Bulgaria 7th Grade

7th Grade Correlation Summary

MeasurementBangladeshiImmigrants from Bulgaria
Minimum83.4%52.9%
Maximum100.0%100.0%
Range16.6%47.1%
Mean94.7%95.4%
Median95.2%97.4%
Interquartile 25% (IQ1)92.8%96.5%
Interquartile 75% (IQ3)96.9%99.2%
Interquartile Range (IQR)4.1%2.7%
Standard Deviation (Sample)3.6%9.9%
Standard Deviation (Population)3.6%9.6%

Similar Demographics by 7th Grade

Demographics Similar to Bangladeshis by 7th Grade

In terms of 7th grade, the demographic groups most similar to Bangladeshis are Immigrants from South Eastern Asia (94.5%, a difference of 0.010%), Indonesian (94.5%, a difference of 0.010%), Immigrants from Burma/Myanmar (94.5%, a difference of 0.040%), Immigrants from Dominica (94.5%, a difference of 0.070%), and Immigrants from Laos (94.5%, a difference of 0.070%).
DemographicsRating | Rank7th Grade
Immigrants | West Indies
0.0
/100
|
#292
Tragic
94.8%
Fijians
0.0
/100
|
#293
Tragic
94.7%
Haitians
0.0
/100
|
#294
Tragic
94.7%
Yaqui
0.0
/100
|
#295
Tragic
94.6%
Cubans
0.0
/100
|
#296
Tragic
94.6%
Immigrants | South Eastern Asia
0.0
/100
|
#297
Tragic
94.5%
Indonesians
0.0
/100
|
#298
Tragic
94.5%
Bangladeshis
0.0
/100
|
#299
Tragic
94.5%
Immigrants | Burma/Myanmar
0.0
/100
|
#300
Tragic
94.5%
Immigrants | Dominica
0.0
/100
|
#301
Tragic
94.5%
Immigrants | Laos
0.0
/100
|
#302
Tragic
94.5%
Sri Lankans
0.0
/100
|
#303
Tragic
94.4%
Immigrants | Haiti
0.0
/100
|
#304
Tragic
94.3%
Guyanese
0.0
/100
|
#305
Tragic
94.3%
Immigrants | Guyana
0.0
/100
|
#306
Tragic
94.2%

Demographics Similar to Immigrants from Bulgaria by 7th Grade

In terms of 7th grade, the demographic groups most similar to Immigrants from Bulgaria are Immigrants from Switzerland (96.5%, a difference of 0.010%), Palestinian (96.4%, a difference of 0.010%), Immigrants from Europe (96.5%, a difference of 0.020%), Immigrants from France (96.5%, a difference of 0.020%), and Immigrants from Bosnia and Herzegovina (96.4%, a difference of 0.020%).
DemographicsRating | Rank7th Grade
Immigrants | Japan
95.5
/100
|
#118
Exceptional
96.5%
Immigrants | Norway
95.2
/100
|
#119
Exceptional
96.5%
Immigrants | Croatia
95.0
/100
|
#120
Exceptional
96.5%
Cheyenne
94.9
/100
|
#121
Exceptional
96.5%
Immigrants | Europe
94.8
/100
|
#122
Exceptional
96.5%
Immigrants | France
94.7
/100
|
#123
Exceptional
96.5%
Immigrants | Switzerland
94.5
/100
|
#124
Exceptional
96.5%
Immigrants | Bulgaria
94.0
/100
|
#125
Exceptional
96.4%
Palestinians
93.5
/100
|
#126
Exceptional
96.4%
Immigrants | Bosnia and Herzegovina
93.3
/100
|
#127
Exceptional
96.4%
Immigrants | Romania
93.2
/100
|
#128
Exceptional
96.4%
Immigrants | North Macedonia
93.1
/100
|
#129
Exceptional
96.4%
Immigrants | Serbia
92.8
/100
|
#130
Exceptional
96.4%
Filipinos
92.1
/100
|
#131
Exceptional
96.4%
Colville
91.7
/100
|
#132
Exceptional
96.4%