Bahamian vs Immigrants from North America Associate's Degree

COMPARE

Bahamian
Race
Ancestry
AfghanAfricanAlaska NativeAlaskan AthabascanAlbanianAleutAlsatianAmericanApacheArabArapahoArgentineanArmenianAssyrian/Chaldean/SyriacAustralianAustrianBahamianBangladeshiBarbadianBasqueBelgianBelizeanBermudanBhutaneseBlackfeetBolivianBrazilianBritishBritish West IndianBulgarianBurmeseCajunCambodianCanadianCape VerdeanCarpatho RusynCelticCentral AmericanCentral American IndianCherokeeCheyenneChickasawChileanChineseChippewaChoctawColombianColvilleComancheCosta RicanCreeCreekCroatianCrowCubanCypriotCzechCzechoslovakianDanishDelawareDominicanDutchDutch West IndianEastern EuropeanEcuadorianEgyptianEnglishEstonianEthiopianEuropeanFijianFilipinoFinnishFrenchFrench American IndianFrench CanadianGermanGerman RussianGhanaianGreekGuamanian/ChamorroGuatemalanGuyaneseHaitianHmongHonduranHopiHoumaHungarianIcelanderIndian (Asian)IndonesianInupiatIranianIraqiIrishIroquoisIsraeliItalianJamaicanJapaneseJordanianKenyanKiowaKoreanLaotianLatvianLebaneseLiberianLithuanianLumbeeLuxembourgerMacedonianMalaysianMalteseMarshalleseMenomineeMexicanMexican American IndianMongolianMoroccanNative HawaiianNavajoNepaleseNew ZealanderNicaraguanNigerianNorthern EuropeanNorwegianOkinawanOsageOttawaPaiutePakistaniPalestinianPanamanianParaguayanPennsylvania GermanPeruvianPimaPolishPortuguesePotawatomiPuebloPuerto RicanPuget Sound SalishRomanianRussianSalvadoranSamoanScandinavianScotch-IrishScottishSeminoleSenegaleseSerbianShoshoneSierra LeoneanSiouxSlavicSlovakSloveneSomaliSouth AfricanSouth AmericanSouth American IndianSoviet UnionSpaniardSpanishSpanish AmericanSpanish American IndianSri LankanSubsaharan AfricanSudaneseSwedishSwissSyrianTaiwaneseThaiTlingit-HaidaTohono O'OdhamTonganTrinidadian and TobagonianTsimshianTurkishU.S. Virgin IslanderUgandanUkrainianUruguayanUteVenezuelanVietnameseWelshWest IndianYakamaYaquiYugoslavianYumanYup'ikZimbabwean
Immigration
NonimmigrantsImmigrantsAfghanistanAfricaAlbaniaArgentinaArmeniaAsiaAustraliaAustriaBahamasBangladeshBarbadosBelarusBelgiumBelizeBoliviaBosnia and HerzegovinaBrazilBulgariaBurma/MyanmarCabo VerdeCambodiaCameroonCanadaCaribbeanCentral AmericaChileChinaColombiaCongoCosta RicaCroatiaCubaCzechoslovakiaDenmarkDominicaDominican RepublicEastern AfricaEastern AsiaEastern EuropeEcuadorEgyptEl SalvadorEnglandEritreaEthiopiaEuropeFijiFranceGermanyGhanaGreeceGrenadaGuatemalaGuyanaHaitiHondurasHong KongHungaryIndiaIndonesiaIranIraqIrelandIsraelItalyJamaicaJapanJordanKazakhstanKenyaKoreaKuwaitLaosLatin AmericaLatviaLebanonLiberiaLithuaniaMalaysiaMexicoMicronesiaMiddle AfricaMoldovaMoroccoNepalNetherlandsNicaraguaNigeriaNorth MacedoniaNorthern AfricaNorthern EuropeNorwayOceaniaPakistanPanamaPeruPhilippinesPolandPortugalRomaniaRussiaSaudi ArabiaScotlandSenegalSerbiaSierra LeoneSingaporeSomaliaSouth AfricaSouth AmericaSouth Central AsiaSouth Eastern AsiaSouthern EuropeSpainSri LankaSt. Vincent and the GrenadinesSudanSwedenSwitzerlandSyriaTaiwanThailandTrinidad and TobagoTurkeyUgandaUkraineUruguayUzbekistanVenezuelaVietnamWest IndiesWestern AfricaWestern AsiaWestern EuropeYemenZaireZimbabweAzores
Immigrants from North America
Race
Ancestry
AfghanAfricanAlaska NativeAlaskan AthabascanAlbanianAleutAlsatianAmericanApacheArabArapahoArgentineanArmenianAssyrian/Chaldean/SyriacAustralianAustrianBangladeshiBarbadianBasqueBelgianBelizeanBermudanBhutaneseBlackfeetBolivianBrazilianBritishBritish West IndianBulgarianBurmeseCajunCambodianCanadianCape VerdeanCarpatho RusynCelticCentral AmericanCentral American IndianCherokeeCheyenneChickasawChileanChineseChippewaChoctawColombianColvilleComancheCosta RicanCreeCreekCroatianCrowCubanCypriotCzechCzechoslovakianDanishDelawareDominicanDutchDutch West IndianEastern EuropeanEcuadorianEgyptianEnglishEstonianEthiopianEuropeanFijianFilipinoFinnishFrenchFrench American IndianFrench CanadianGermanGerman RussianGhanaianGreekGuamanian/ChamorroGuatemalanGuyaneseHaitianHmongHonduranHopiHoumaHungarianIcelanderIndian (Asian)IndonesianInupiatIranianIraqiIrishIroquoisIsraeliItalianJamaicanJapaneseJordanianKenyanKiowaKoreanLaotianLatvianLebaneseLiberianLithuanianLumbeeLuxembourgerMacedonianMalaysianMalteseMarshalleseMenomineeMexicanMexican American IndianMongolianMoroccanNative HawaiianNavajoNepaleseNew ZealanderNicaraguanNigerianNorthern EuropeanNorwegianOkinawanOsageOttawaPaiutePakistaniPalestinianPanamanianParaguayanPennsylvania GermanPeruvianPimaPolishPortuguesePotawatomiPuebloPuerto RicanPuget Sound SalishRomanianRussianSalvadoranSamoanScandinavianScotch-IrishScottishSeminoleSenegaleseSerbianShoshoneSierra LeoneanSiouxSlavicSlovakSloveneSomaliSouth AfricanSouth AmericanSouth American IndianSoviet UnionSpaniardSpanishSpanish AmericanSpanish American IndianSri LankanSubsaharan AfricanSudaneseSwedishSwissSyrianTaiwaneseThaiTlingit-HaidaTohono O'OdhamTonganTrinidadian and TobagonianTsimshianTurkishU.S. Virgin IslanderUgandanUkrainianUruguayanUteVenezuelanVietnameseWelshWest IndianYakamaYaquiYugoslavianYumanYup'ikZimbabwean
Immigration
NonimmigrantsImmigrantsAfghanistanAfricaAlbaniaArgentinaArmeniaAsiaAustraliaAustriaBahamasBangladeshBarbadosBelarusBelgiumBelizeBoliviaBosnia and HerzegovinaBrazilBulgariaBurma/MyanmarCabo VerdeCambodiaCameroonCanadaCaribbeanCentral AmericaChileChinaColombiaCongoCosta RicaCroatiaCubaCzechoslovakiaDenmarkDominicaDominican RepublicEastern AfricaEastern AsiaEastern EuropeEcuadorEgyptEl SalvadorEnglandEritreaEthiopiaEuropeFijiFranceGermanyGhanaGreeceGrenadaGuatemalaGuyanaHaitiHondurasHong KongHungaryIndiaIndonesiaIranIraqIrelandIsraelItalyJamaicaJapanJordanKazakhstanKenyaKoreaKuwaitLaosLatin AmericaLatviaLebanonLiberiaLithuaniaMalaysiaMexicoMicronesiaMiddle AfricaMoldovaMoroccoNepalNetherlandsNicaraguaNigeriaNorth AmericaNorth MacedoniaNorthern AfricaNorthern EuropeNorwayOceaniaPakistanPanamaPeruPhilippinesPolandPortugalRomaniaRussiaSaudi ArabiaScotlandSenegalSerbiaSierra LeoneSingaporeSomaliaSouth AfricaSouth AmericaSouth Central AsiaSouth Eastern AsiaSouthern EuropeSpainSri LankaSt. Vincent and the GrenadinesSudanSwedenSwitzerlandSyriaTaiwanThailandTrinidad and TobagoTurkeyUgandaUkraineUruguayUzbekistanVenezuelaVietnamWest IndiesWestern AfricaWestern AsiaWestern EuropeYemenZaireZimbabweAzores
Associate's Degree
Income
Poverty
Unemployment
Labor Participation
Family Structure
Vehicle Availability
Education Level
Disability

Associate's Degree Comparison

Bahamians

Immigrants from North America

Tragic
Exceptional
41.5%
ASSOCIATE'S DEGREE
0.4/ 100
METRIC RATING
262nd/ 347
METRIC RANK
50.1%
ASSOCIATE'S DEGREE
98.7/ 100
METRIC RATING
92nd/ 347
METRIC RANK

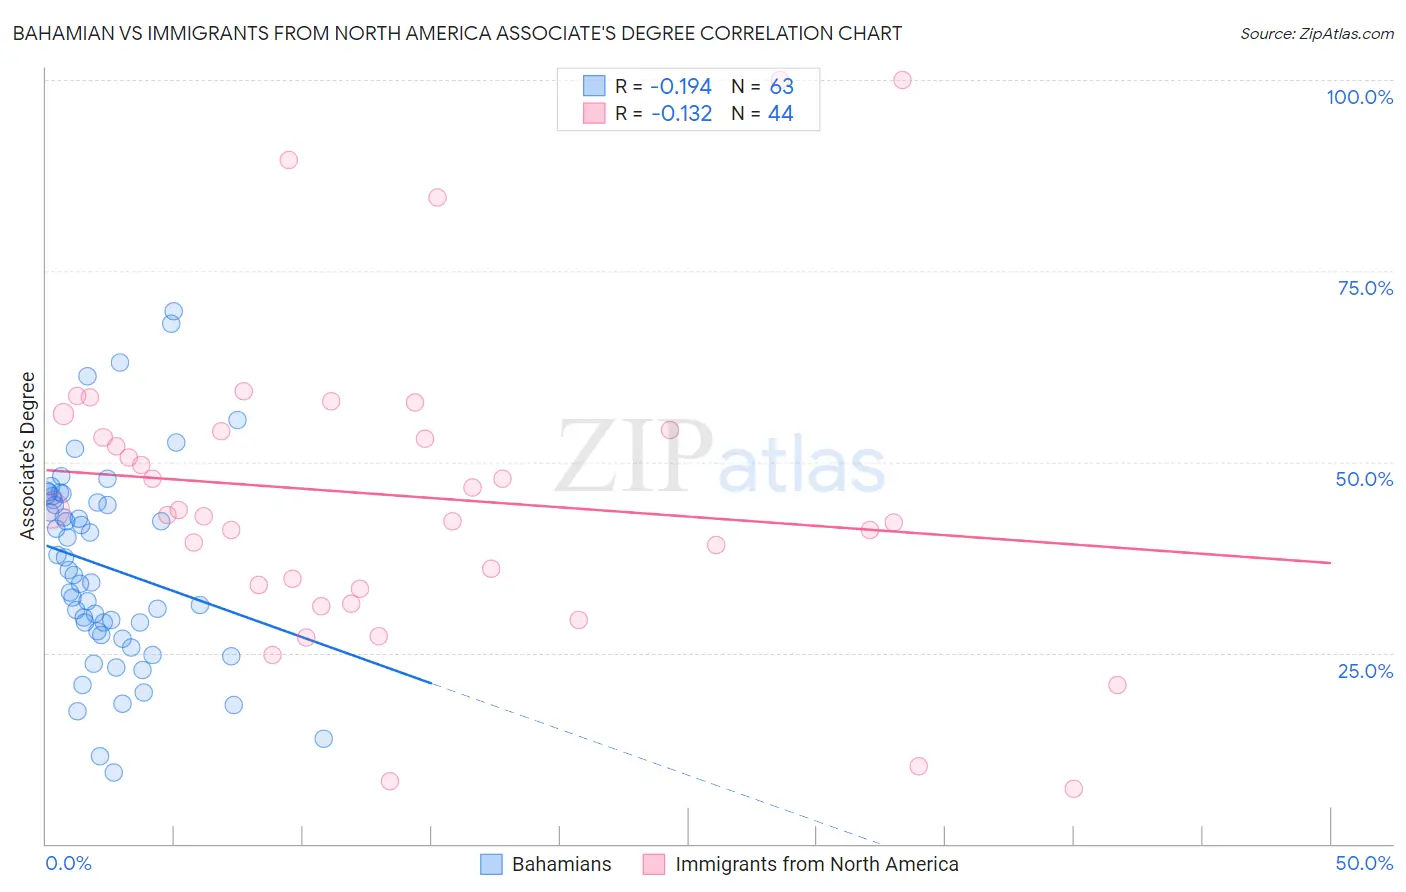
Bahamian vs Immigrants from North America Associate's Degree Correlation Chart

The statistical analysis conducted on geographies consisting of 112,704,799 people shows a poor negative correlation between the proportion of Bahamians and percentage of population with at least associate's degree education in the United States with a correlation coefficient (R) of -0.194 and weighted average of 41.5%. Similarly, the statistical analysis conducted on geographies consisting of 462,434,172 people shows a poor negative correlation between the proportion of Immigrants from North America and percentage of population with at least associate's degree education in the United States with a correlation coefficient (R) of -0.132 and weighted average of 50.1%, a difference of 20.8%.
Bahamian vs Immigrants from North America Associate's Degree

Associate's Degree Correlation Summary

MeasurementBahamianImmigrants from North America
Minimum9.3%7.1%
Maximum69.7%100.0%
Range60.4%92.9%
Mean36.3%45.6%
Median35.2%43.4%
Interquartile 25% (IQ1)27.3%33.6%
Interquartile 75% (IQ3)45.0%54.1%
Interquartile Range (IQR)17.7%20.5%
Standard Deviation (Sample)13.1%20.4%
Standard Deviation (Population)13.0%20.1%

Similar Demographics by Associate's Degree

Demographics Similar to Bahamians by Associate's Degree

In terms of associate's degree, the demographic groups most similar to Bahamians are Immigrants from Jamaica (41.5%, a difference of 0.020%), Osage (41.5%, a difference of 0.030%), Nicaraguan (41.5%, a difference of 0.090%), Marshallese (41.6%, a difference of 0.22%), and Malaysian (41.6%, a difference of 0.41%).
DemographicsRating | RankAssociate's Degree
Immigrants | Guyana
0.5
/100
|
#255
Tragic
41.8%
Immigrants | Congo
0.5
/100
|
#256
Tragic
41.8%
Spanish Americans
0.5
/100
|
#257
Tragic
41.8%
Japanese
0.5
/100
|
#258
Tragic
41.7%
Malaysians
0.4
/100
|
#259
Tragic
41.6%
Marshallese
0.4
/100
|
#260
Tragic
41.6%
Nicaraguans
0.4
/100
|
#261
Tragic
41.5%
Bahamians
0.4
/100
|
#262
Tragic
41.5%
Immigrants | Jamaica
0.3
/100
|
#263
Tragic
41.5%
Osage
0.3
/100
|
#264
Tragic
41.5%
Africans
0.2
/100
|
#265
Tragic
41.1%
Samoans
0.2
/100
|
#266
Tragic
41.1%
Hawaiians
0.2
/100
|
#267
Tragic
40.9%
Central American Indians
0.2
/100
|
#268
Tragic
40.8%
Americans
0.2
/100
|
#269
Tragic
40.8%

Demographics Similar to Immigrants from North America by Associate's Degree

In terms of associate's degree, the demographic groups most similar to Immigrants from North America are Immigrants from Western Asia (50.1%, a difference of 0.020%), Immigrants from Ethiopia (50.1%, a difference of 0.10%), Immigrants from Canada (50.1%, a difference of 0.11%), Immigrants from Western Europe (50.1%, a difference of 0.11%), and Immigrants from Brazil (50.0%, a difference of 0.15%).
DemographicsRating | RankAssociate's Degree
Immigrants | Egypt
98.9
/100
|
#85
Exceptional
50.2%
Immigrants | Croatia
98.9
/100
|
#86
Exceptional
50.2%
Immigrants | Moldova
98.8
/100
|
#87
Exceptional
50.2%
Immigrants | Canada
98.7
/100
|
#88
Exceptional
50.1%
Immigrants | Western Europe
98.7
/100
|
#89
Exceptional
50.1%
Immigrants | Ethiopia
98.7
/100
|
#90
Exceptional
50.1%
Immigrants | Western Asia
98.7
/100
|
#91
Exceptional
50.1%
Immigrants | North America
98.7
/100
|
#92
Exceptional
50.1%
Immigrants | Brazil
98.5
/100
|
#93
Exceptional
50.0%
Laotians
98.4
/100
|
#94
Exceptional
49.9%
Immigrants | England
98.0
/100
|
#95
Exceptional
49.7%
Romanians
98.0
/100
|
#96
Exceptional
49.7%
Immigrants | Ukraine
98.0
/100
|
#97
Exceptional
49.7%
Immigrants | Northern Africa
97.9
/100
|
#98
Exceptional
49.7%
Macedonians
97.8
/100
|
#99
Exceptional
49.6%