Bahamian vs Immigrants from Congo 7th Grade

COMPARE

Bahamian
Race
Ancestry
AfghanAfricanAlaska NativeAlaskan AthabascanAlbanianAleutAlsatianAmericanApacheArabArapahoArgentineanArmenianAssyrian/Chaldean/SyriacAustralianAustrianBahamianBangladeshiBarbadianBasqueBelgianBelizeanBermudanBhutaneseBlackfeetBolivianBrazilianBritishBritish West IndianBulgarianBurmeseCajunCambodianCanadianCape VerdeanCarpatho RusynCelticCentral AmericanCentral American IndianCherokeeCheyenneChickasawChileanChineseChippewaChoctawColombianColvilleComancheCosta RicanCreeCreekCroatianCrowCubanCypriotCzechCzechoslovakianDanishDelawareDominicanDutchDutch West IndianEastern EuropeanEcuadorianEgyptianEnglishEstonianEthiopianEuropeanFijianFilipinoFinnishFrenchFrench American IndianFrench CanadianGermanGerman RussianGhanaianGreekGuamanian/ChamorroGuatemalanGuyaneseHaitianHmongHonduranHopiHoumaHungarianIcelanderIndian (Asian)IndonesianInupiatIranianIraqiIrishIroquoisIsraeliItalianJamaicanJapaneseJordanianKenyanKiowaKoreanLaotianLatvianLebaneseLiberianLithuanianLumbeeLuxembourgerMacedonianMalaysianMalteseMarshalleseMenomineeMexicanMexican American IndianMongolianMoroccanNative HawaiianNavajoNepaleseNew ZealanderNicaraguanNigerianNorthern EuropeanNorwegianOkinawanOsageOttawaPaiutePakistaniPalestinianPanamanianParaguayanPennsylvania GermanPeruvianPimaPolishPortuguesePotawatomiPuebloPuerto RicanPuget Sound SalishRomanianRussianSalvadoranSamoanScandinavianScotch-IrishScottishSeminoleSenegaleseSerbianShoshoneSierra LeoneanSiouxSlavicSlovakSloveneSomaliSouth AfricanSouth AmericanSouth American IndianSoviet UnionSpaniardSpanishSpanish AmericanSpanish American IndianSri LankanSubsaharan AfricanSudaneseSwedishSwissSyrianTaiwaneseThaiTlingit-HaidaTohono O'OdhamTonganTrinidadian and TobagonianTsimshianTurkishU.S. Virgin IslanderUgandanUkrainianUruguayanUteVenezuelanVietnameseWelshWest IndianYakamaYaquiYugoslavianYumanYup'ikZimbabwean
Immigration
NonimmigrantsImmigrantsAfghanistanAfricaAlbaniaArgentinaArmeniaAsiaAustraliaAustriaBahamasBangladeshBarbadosBelarusBelgiumBelizeBoliviaBosnia and HerzegovinaBrazilBulgariaBurma/MyanmarCabo VerdeCambodiaCameroonCanadaCaribbeanCentral AmericaChileChinaColombiaCosta RicaCroatiaCubaCzechoslovakiaDenmarkDominicaDominican RepublicEastern AfricaEastern AsiaEastern EuropeEcuadorEgyptEl SalvadorEnglandEritreaEthiopiaEuropeFijiFranceGermanyGhanaGreeceGrenadaGuatemalaGuyanaHaitiHondurasHong KongHungaryIndiaIndonesiaIranIraqIrelandIsraelItalyJamaicaJapanJordanKazakhstanKenyaKoreaKuwaitLaosLatin AmericaLatviaLebanonLiberiaLithuaniaMalaysiaMexicoMicronesiaMiddle AfricaMoldovaMoroccoNepalNetherlandsNicaraguaNigeriaNorth AmericaNorth MacedoniaNorthern AfricaNorthern EuropeNorwayOceaniaPakistanPanamaPeruPhilippinesPolandPortugalRomaniaRussiaSaudi ArabiaScotlandSenegalSerbiaSierra LeoneSingaporeSomaliaSouth AfricaSouth AmericaSouth Central AsiaSouth Eastern AsiaSouthern EuropeSpainSri LankaSt. Vincent and the GrenadinesSudanSwedenSwitzerlandSyriaTaiwanThailandTrinidad and TobagoTurkeyUgandaUkraineUruguayUzbekistanVenezuelaVietnamWest IndiesWestern AfricaWestern AsiaWestern EuropeYemenZaireZimbabweAzores
Immigrants from Congo
Race
Ancestry
AfghanAfricanAlaska NativeAlaskan AthabascanAlbanianAleutAlsatianAmericanApacheArabArapahoArgentineanArmenianAssyrian/Chaldean/SyriacAustralianAustrianBangladeshiBarbadianBasqueBelgianBelizeanBermudanBhutaneseBlackfeetBolivianBrazilianBritishBritish West IndianBulgarianBurmeseCajunCambodianCanadianCape VerdeanCarpatho RusynCelticCentral AmericanCentral American IndianCherokeeCheyenneChickasawChileanChineseChippewaChoctawColombianColvilleComancheCosta RicanCreeCreekCroatianCrowCubanCypriotCzechCzechoslovakianDanishDelawareDominicanDutchDutch West IndianEastern EuropeanEcuadorianEgyptianEnglishEstonianEthiopianEuropeanFijianFilipinoFinnishFrenchFrench American IndianFrench CanadianGermanGerman RussianGhanaianGreekGuamanian/ChamorroGuatemalanGuyaneseHaitianHmongHonduranHopiHoumaHungarianIcelanderIndian (Asian)IndonesianInupiatIranianIraqiIrishIroquoisIsraeliItalianJamaicanJapaneseJordanianKenyanKiowaKoreanLaotianLatvianLebaneseLiberianLithuanianLumbeeLuxembourgerMacedonianMalaysianMalteseMarshalleseMenomineeMexicanMexican American IndianMongolianMoroccanNative HawaiianNavajoNepaleseNew ZealanderNicaraguanNigerianNorthern EuropeanNorwegianOkinawanOsageOttawaPaiutePakistaniPalestinianPanamanianParaguayanPennsylvania GermanPeruvianPimaPolishPortuguesePotawatomiPuebloPuerto RicanPuget Sound SalishRomanianRussianSalvadoranSamoanScandinavianScotch-IrishScottishSeminoleSenegaleseSerbianShoshoneSierra LeoneanSiouxSlavicSlovakSloveneSomaliSouth AfricanSouth AmericanSouth American IndianSoviet UnionSpaniardSpanishSpanish AmericanSpanish American IndianSri LankanSubsaharan AfricanSudaneseSwedishSwissSyrianTaiwaneseThaiTlingit-HaidaTohono O'OdhamTonganTrinidadian and TobagonianTsimshianTurkishU.S. Virgin IslanderUgandanUkrainianUruguayanUteVenezuelanVietnameseWelshWest IndianYakamaYaquiYugoslavianYumanYup'ikZimbabwean
Immigration
NonimmigrantsImmigrantsAfghanistanAfricaAlbaniaArgentinaArmeniaAsiaAustraliaAustriaBahamasBangladeshBarbadosBelarusBelgiumBelizeBoliviaBosnia and HerzegovinaBrazilBulgariaBurma/MyanmarCabo VerdeCambodiaCameroonCanadaCaribbeanCentral AmericaChileChinaColombiaCongoCosta RicaCroatiaCubaCzechoslovakiaDenmarkDominicaDominican RepublicEastern AfricaEastern AsiaEastern EuropeEcuadorEgyptEl SalvadorEnglandEritreaEthiopiaEuropeFijiFranceGermanyGhanaGreeceGrenadaGuatemalaGuyanaHaitiHondurasHong KongHungaryIndiaIndonesiaIranIraqIrelandIsraelItalyJamaicaJapanJordanKazakhstanKenyaKoreaKuwaitLaosLatin AmericaLatviaLebanonLiberiaLithuaniaMalaysiaMexicoMicronesiaMiddle AfricaMoldovaMoroccoNepalNetherlandsNicaraguaNigeriaNorth AmericaNorth MacedoniaNorthern AfricaNorthern EuropeNorwayOceaniaPakistanPanamaPeruPhilippinesPolandPortugalRomaniaRussiaSaudi ArabiaScotlandSenegalSerbiaSierra LeoneSingaporeSomaliaSouth AfricaSouth AmericaSouth Central AsiaSouth Eastern AsiaSouthern EuropeSpainSri LankaSt. Vincent and the GrenadinesSudanSwedenSwitzerlandSyriaTaiwanThailandTrinidad and TobagoTurkeyUgandaUkraineUruguayUzbekistanVenezuelaVietnamWest IndiesWestern AfricaWestern AsiaWestern EuropeYemenZaireZimbabweAzores
7th Grade
Income
Poverty
Unemployment
Labor Participation
Family Structure
Vehicle Availability
Education Level
Disability

7th Grade Comparison

Bahamians

Immigrants from Congo

Poor
Tragic
95.7%
7TH GRADE
11.6/ 100
METRIC RATING
214th/ 347
METRIC RANK
95.3%
7TH GRADE
0.7/ 100
METRIC RATING
257th/ 347
METRIC RANK

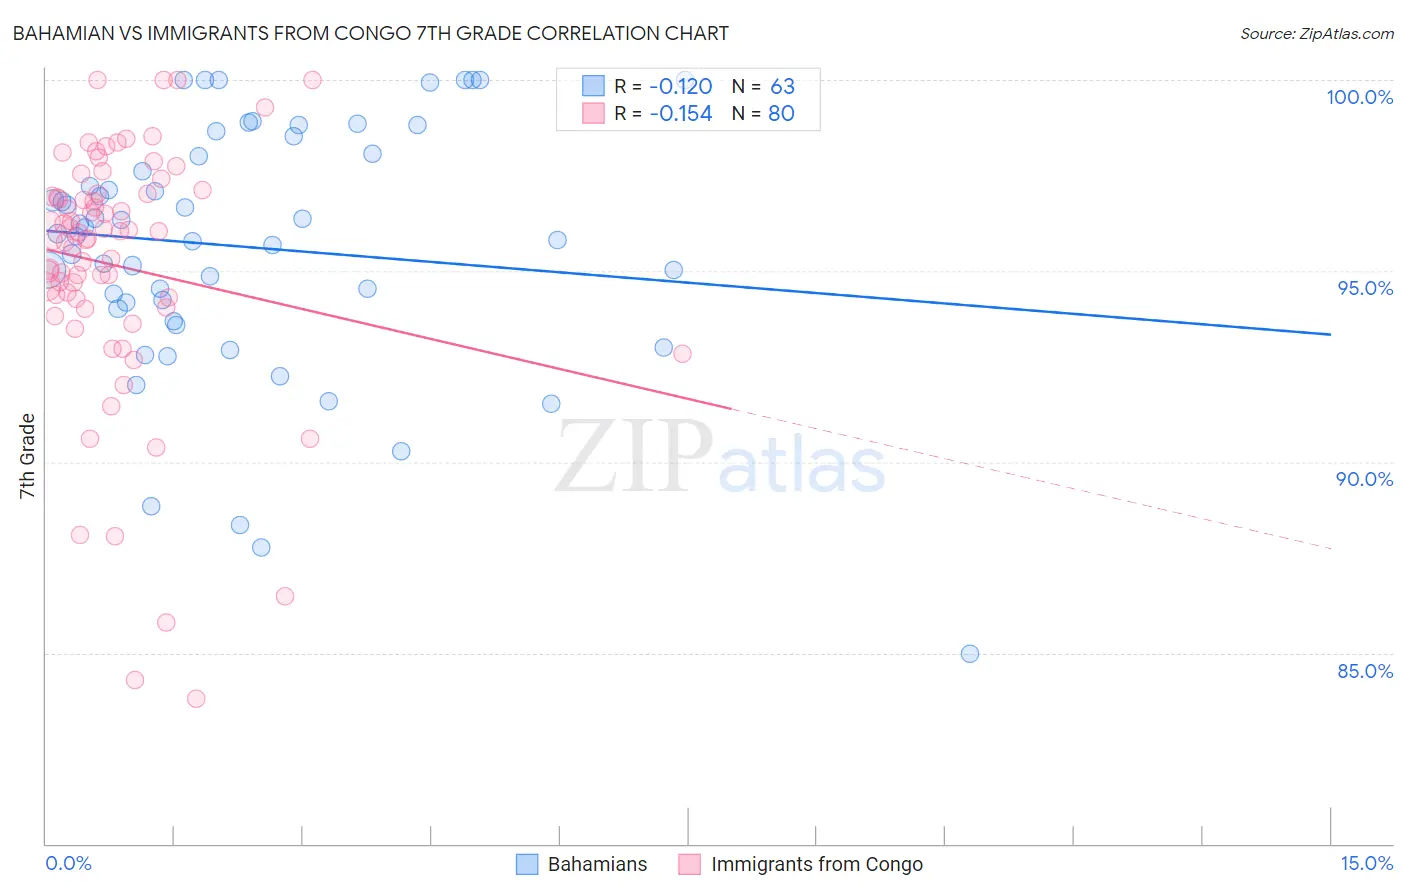
Bahamian vs Immigrants from Congo 7th Grade Correlation Chart

The statistical analysis conducted on geographies consisting of 112,698,819 people shows a poor negative correlation between the proportion of Bahamians and percentage of population with at least 7th grade education in the United States with a correlation coefficient (R) of -0.120 and weighted average of 95.7%. Similarly, the statistical analysis conducted on geographies consisting of 92,124,753 people shows a poor negative correlation between the proportion of Immigrants from Congo and percentage of population with at least 7th grade education in the United States with a correlation coefficient (R) of -0.154 and weighted average of 95.3%, a difference of 0.45%.
Bahamian vs Immigrants from Congo 7th Grade

7th Grade Correlation Summary

MeasurementBahamianImmigrants from Congo
Minimum85.0%83.8%
Maximum100.0%100.0%
Range15.0%16.2%
Mean95.6%95.1%
Median96.0%95.9%
Interquartile 25% (IQ1)94.0%94.2%
Interquartile 75% (IQ3)98.1%97.0%
Interquartile Range (IQR)4.1%2.9%
Standard Deviation (Sample)3.3%3.4%
Standard Deviation (Population)3.3%3.4%

Similar Demographics by 7th Grade

Demographics Similar to Bahamians by 7th Grade

In terms of 7th grade, the demographic groups most similar to Bahamians are Immigrants from Morocco (95.8%, a difference of 0.010%), Immigrants from Lebanon (95.8%, a difference of 0.020%), Portuguese (95.8%, a difference of 0.030%), Spanish American (95.7%, a difference of 0.040%), and Immigrants from Chile (95.7%, a difference of 0.040%).
DemographicsRating | Rank7th Grade
Navajo
17.0
/100
|
#207
Poor
95.8%
Immigrants | Sudan
17.0
/100
|
#208
Poor
95.8%
Dutch West Indians
16.1
/100
|
#209
Poor
95.8%
Hawaiians
16.0
/100
|
#210
Poor
95.8%
Portuguese
13.6
/100
|
#211
Poor
95.8%
Immigrants | Lebanon
13.0
/100
|
#212
Poor
95.8%
Immigrants | Morocco
12.6
/100
|
#213
Poor
95.8%
Bahamians
11.6
/100
|
#214
Poor
95.7%
Spanish Americans
9.3
/100
|
#215
Tragic
95.7%
Immigrants | Chile
9.1
/100
|
#216
Tragic
95.7%
Immigrants | Pakistan
9.0
/100
|
#217
Tragic
95.7%
Immigrants | Liberia
8.1
/100
|
#218
Tragic
95.7%
Immigrants | Southern Europe
7.9
/100
|
#219
Tragic
95.7%
Sub-Saharan Africans
7.2
/100
|
#220
Tragic
95.7%
Samoans
7.0
/100
|
#221
Tragic
95.7%

Demographics Similar to Immigrants from Congo by 7th Grade

In terms of 7th grade, the demographic groups most similar to Immigrants from Congo are Immigrants from China (95.3%, a difference of 0.0%), Ghanaian (95.3%, a difference of 0.0%), Korean (95.3%, a difference of 0.010%), Colombian (95.3%, a difference of 0.020%), and Somali (95.3%, a difference of 0.030%).
DemographicsRating | Rank7th Grade
Immigrants | Cameroon
0.9
/100
|
#250
Tragic
95.4%
Immigrants | Jamaica
0.9
/100
|
#251
Tragic
95.4%
Immigrants | Ethiopia
0.9
/100
|
#252
Tragic
95.3%
Somalis
0.9
/100
|
#253
Tragic
95.3%
Colombians
0.8
/100
|
#254
Tragic
95.3%
Koreans
0.8
/100
|
#255
Tragic
95.3%
Immigrants | China
0.7
/100
|
#256
Tragic
95.3%
Immigrants | Congo
0.7
/100
|
#257
Tragic
95.3%
Ghanaians
0.7
/100
|
#258
Tragic
95.3%
Immigrants | Costa Rica
0.6
/100
|
#259
Tragic
95.3%
Afghans
0.5
/100
|
#260
Tragic
95.3%
South Americans
0.5
/100
|
#261
Tragic
95.2%
Immigrants | Somalia
0.5
/100
|
#262
Tragic
95.2%
West Indians
0.5
/100
|
#263
Tragic
95.2%
Immigrants | Nigeria
0.4
/100
|
#264
Tragic
95.2%