Bahamian vs Immigrants from Brazil 4th Grade
COMPARE
Bahamian
Immigrants from Brazil
4th Grade
4th Grade Comparison
Bahamians
Immigrants from Brazil
97.2%
4TH GRADE
3.8/ 100
METRIC RATING
226th/ 347
METRIC RANK
97.5%
4TH GRADE
46.1/ 100
METRIC RATING
177th/ 347
METRIC RANK
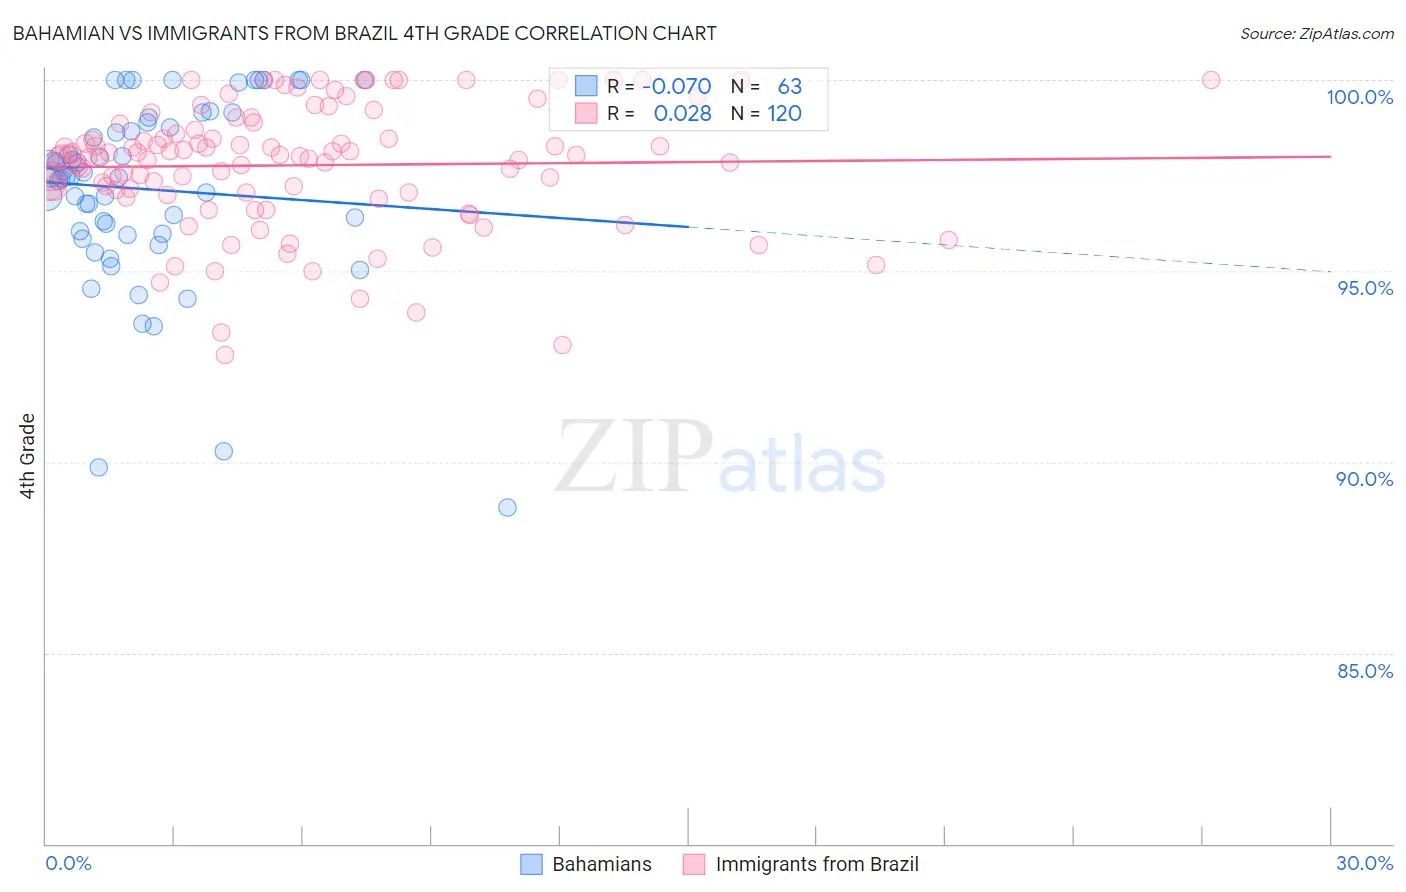
Bahamian vs Immigrants from Brazil 4th Grade Correlation Chart
The statistical analysis conducted on geographies consisting of 112,698,819 people shows a slight negative correlation between the proportion of Bahamians and percentage of population with at least 4th grade education in the United States with a correlation coefficient (R) of -0.070 and weighted average of 97.2%. Similarly, the statistical analysis conducted on geographies consisting of 343,021,580 people shows no correlation between the proportion of Immigrants from Brazil and percentage of population with at least 4th grade education in the United States with a correlation coefficient (R) of 0.028 and weighted average of 97.5%, a difference of 0.29%.
4th Grade Correlation Summary
| Measurement | Bahamian | Immigrants from Brazil |
| Minimum | 88.8% | 92.8% |
| Maximum | 100.0% | 100.0% |
| Range | 11.2% | 7.2% |
| Mean | 97.1% | 97.8% |
| Median | 97.4% | 98.0% |
| Interquartile 25% (IQ1) | 96.0% | 97.0% |
| Interquartile 75% (IQ3) | 98.9% | 98.8% |
| Interquartile Range (IQR) | 2.9% | 1.7% |
| Standard Deviation (Sample) | 2.4% | 1.6% |
| Standard Deviation (Population) | 2.4% | 1.6% |
Similar Demographics by 4th Grade
Demographics Similar to Bahamians by 4th Grade
In terms of 4th grade, the demographic groups most similar to Bahamians are Immigrants from Pakistan (97.2%, a difference of 0.0%), Subsaharan African (97.2%, a difference of 0.010%), Liberian (97.2%, a difference of 0.010%), Uruguayan (97.2%, a difference of 0.010%), and Immigrants from Malaysia (97.2%, a difference of 0.010%).
| Demographics | Rating | Rank | 4th Grade |
| Tongans | 5.8 /100 | #219 | Tragic 97.3% |
| South American Indians | 5.5 /100 | #220 | Tragic 97.3% |
| Immigrants | Panama | 5.4 /100 | #221 | Tragic 97.3% |
| Immigrants | Lebanon | 5.1 /100 | #222 | Tragic 97.3% |
| Immigrants | Sudan | 5.0 /100 | #223 | Tragic 97.2% |
| Immigrants | Syria | 5.0 /100 | #224 | Tragic 97.2% |
| Immigrants | Iraq | 4.6 /100 | #225 | Tragic 97.2% |
| Bahamians | 3.8 /100 | #226 | Tragic 97.2% |
| Immigrants | Pakistan | 3.7 /100 | #227 | Tragic 97.2% |
| Sub-Saharan Africans | 3.6 /100 | #228 | Tragic 97.2% |
| Liberians | 3.6 /100 | #229 | Tragic 97.2% |
| Uruguayans | 3.5 /100 | #230 | Tragic 97.2% |
| Immigrants | Malaysia | 3.4 /100 | #231 | Tragic 97.2% |
| Immigrants | Western Asia | 3.4 /100 | #232 | Tragic 97.2% |
| Senegalese | 3.1 /100 | #233 | Tragic 97.2% |
Demographics Similar to Immigrants from Brazil by 4th Grade
In terms of 4th grade, the demographic groups most similar to Immigrants from Brazil are Comanche (97.5%, a difference of 0.0%), Egyptian (97.5%, a difference of 0.010%), Immigrants from Micronesia (97.5%, a difference of 0.010%), Arab (97.5%, a difference of 0.010%), and Immigrants from Kazakhstan (97.5%, a difference of 0.010%).
| Demographics | Rating | Rank | 4th Grade |
| Immigrants | Spain | 51.8 /100 | #170 | Average 97.5% |
| Brazilians | 51.5 /100 | #171 | Average 97.5% |
| Immigrants | Sri Lanka | 51.1 /100 | #172 | Average 97.5% |
| Immigrants | Korea | 50.6 /100 | #173 | Average 97.5% |
| Egyptians | 50.0 /100 | #174 | Average 97.5% |
| Immigrants | Micronesia | 49.6 /100 | #175 | Average 97.5% |
| Arabs | 48.7 /100 | #176 | Average 97.5% |
| Immigrants | Brazil | 46.1 /100 | #177 | Average 97.5% |
| Comanche | 45.3 /100 | #178 | Average 97.5% |
| Immigrants | Kazakhstan | 43.6 /100 | #179 | Average 97.5% |
| Immigrants | Venezuela | 42.7 /100 | #180 | Average 97.5% |
| Immigrants | Taiwan | 41.5 /100 | #181 | Average 97.5% |
| Spanish Americans | 39.3 /100 | #182 | Fair 97.5% |
| Argentineans | 39.0 /100 | #183 | Fair 97.5% |
| Pakistanis | 36.2 /100 | #184 | Fair 97.5% |