Bahamian vs Danish Doctorate Degree
COMPARE
Bahamian
Danish
Doctorate Degree
Doctorate Degree Comparison
Bahamians
Danes
1.5%
DOCTORATE DEGREE
0.4/ 100
METRIC RATING
277th/ 347
METRIC RANK
1.9%
DOCTORATE DEGREE
71.9/ 100
METRIC RATING
157th/ 347
METRIC RANK
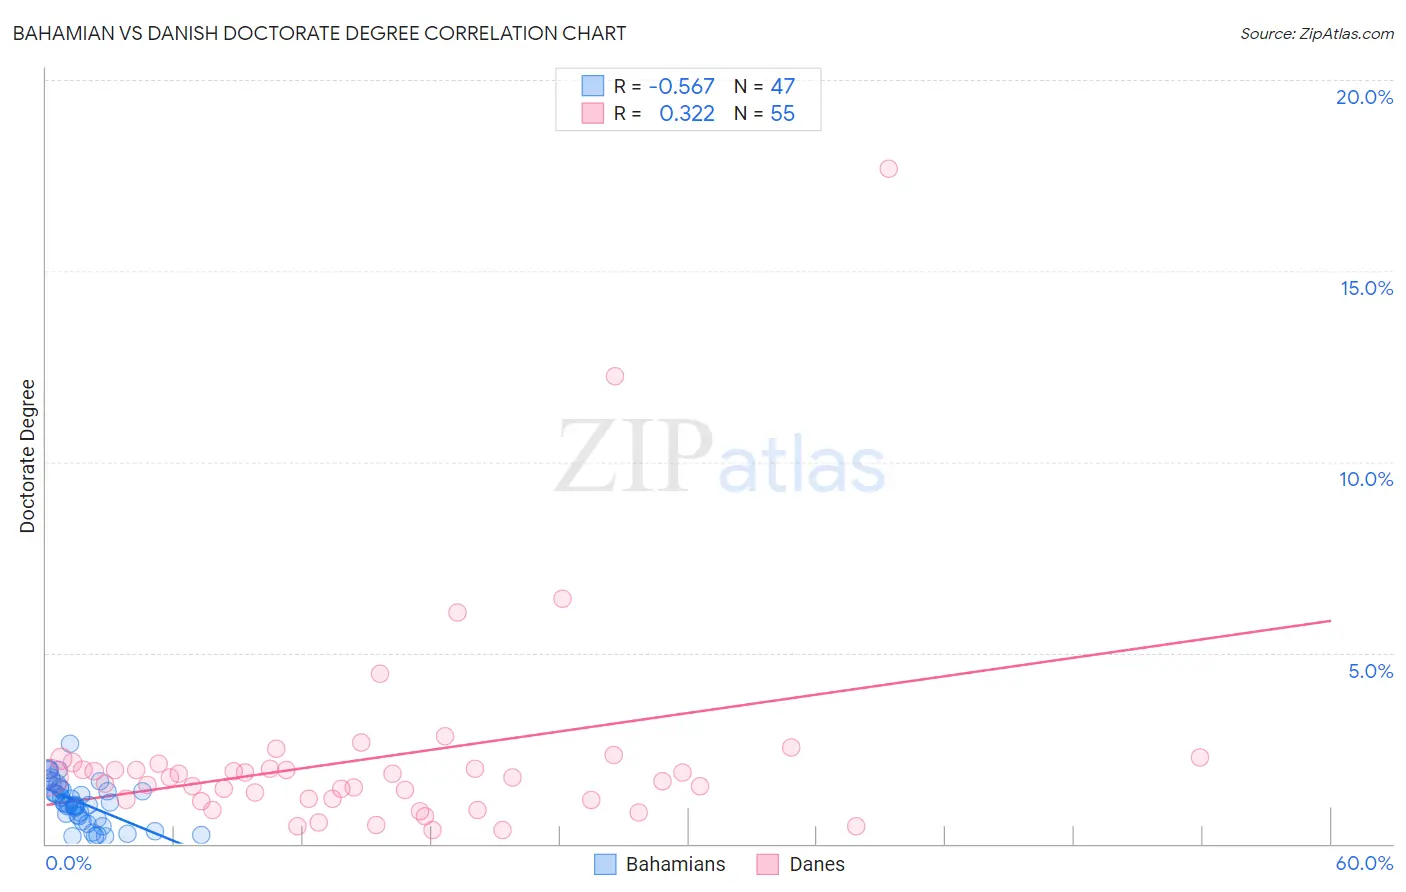
Bahamian vs Danish Doctorate Degree Correlation Chart
The statistical analysis conducted on geographies consisting of 112,287,589 people shows a substantial negative correlation between the proportion of Bahamians and percentage of population with at least doctorate degree education in the United States with a correlation coefficient (R) of -0.567 and weighted average of 1.5%. Similarly, the statistical analysis conducted on geographies consisting of 464,600,564 people shows a mild positive correlation between the proportion of Danes and percentage of population with at least doctorate degree education in the United States with a correlation coefficient (R) of 0.322 and weighted average of 1.9%, a difference of 30.0%.
Doctorate Degree Correlation Summary
| Measurement | Bahamian | Danish |
| Minimum | 0.18% | 0.36% |
| Maximum | 2.6% | 17.7% |
| Range | 2.5% | 17.3% |
| Mean | 1.1% | 2.3% |
| Median | 1.0% | 1.7% |
| Interquartile 25% (IQ1) | 0.64% | 1.2% |
| Interquartile 75% (IQ3) | 1.4% | 2.1% |
| Interquartile Range (IQR) | 0.80% | 0.94% |
| Standard Deviation (Sample) | 0.57% | 2.8% |
| Standard Deviation (Population) | 0.57% | 2.8% |
Similar Demographics by Doctorate Degree
Demographics Similar to Bahamians by Doctorate Degree
In terms of doctorate degree, the demographic groups most similar to Bahamians are Hawaiian (1.5%, a difference of 0.060%), Marshallese (1.5%, a difference of 0.28%), Ecuadorian (1.5%, a difference of 0.29%), Tohono O'odham (1.5%, a difference of 0.35%), and British West Indian (1.5%, a difference of 0.41%).
| Demographics | Rating | Rank | Doctorate Degree |
| Salvadorans | 0.5 /100 | #270 | Tragic 1.5% |
| Immigrants | Trinidad and Tobago | 0.5 /100 | #271 | Tragic 1.5% |
| Immigrants | Barbados | 0.4 /100 | #272 | Tragic 1.5% |
| Sioux | 0.4 /100 | #273 | Tragic 1.5% |
| Yaqui | 0.4 /100 | #274 | Tragic 1.5% |
| Aleuts | 0.4 /100 | #275 | Tragic 1.5% |
| Paiute | 0.4 /100 | #276 | Tragic 1.5% |
| Bahamians | 0.4 /100 | #277 | Tragic 1.5% |
| Hawaiians | 0.4 /100 | #278 | Tragic 1.5% |
| Marshallese | 0.4 /100 | #279 | Tragic 1.5% |
| Ecuadorians | 0.4 /100 | #280 | Tragic 1.5% |
| Tohono O'odham | 0.4 /100 | #281 | Tragic 1.5% |
| British West Indians | 0.3 /100 | #282 | Tragic 1.5% |
| Central Americans | 0.3 /100 | #283 | Tragic 1.5% |
| Jamaicans | 0.3 /100 | #284 | Tragic 1.5% |
Demographics Similar to Danes by Doctorate Degree
In terms of doctorate degree, the demographic groups most similar to Danes are Hungarian (1.9%, a difference of 0.030%), Slavic (1.9%, a difference of 0.090%), Polish (1.9%, a difference of 0.14%), Immigrants from Albania (1.9%, a difference of 0.16%), and Slovene (1.9%, a difference of 0.29%).
| Demographics | Rating | Rank | Doctorate Degree |
| English | 75.9 /100 | #150 | Good 1.9% |
| Albanians | 74.8 /100 | #151 | Good 1.9% |
| Immigrants | Kenya | 74.3 /100 | #152 | Good 1.9% |
| Immigrants | Oceania | 74.0 /100 | #153 | Good 1.9% |
| Immigrants | Albania | 72.8 /100 | #154 | Good 1.9% |
| Poles | 72.7 /100 | #155 | Good 1.9% |
| Slavs | 72.4 /100 | #156 | Good 1.9% |
| Danes | 71.9 /100 | #157 | Good 1.9% |
| Hungarians | 71.7 /100 | #158 | Good 1.9% |
| Slovenes | 70.2 /100 | #159 | Good 1.9% |
| Welsh | 69.7 /100 | #160 | Good 1.9% |
| Immigrants | Middle Africa | 68.8 /100 | #161 | Good 1.9% |
| Irish | 67.5 /100 | #162 | Good 1.9% |
| Czechs | 67.3 /100 | #163 | Good 1.9% |
| Celtics | 66.7 /100 | #164 | Good 1.9% |