Bahamian vs Afghan High School Diploma

COMPARE

Bahamian
Race
Ancestry
AfricanAlaska NativeAlaskan AthabascanAlbanianAleutAlsatianAmericanApacheArabArapahoArgentineanArmenianAssyrian/Chaldean/SyriacAustralianAustrianBahamianBangladeshiBarbadianBasqueBelgianBelizeanBermudanBhutaneseBlackfeetBolivianBrazilianBritishBritish West IndianBulgarianBurmeseCajunCambodianCanadianCape VerdeanCarpatho RusynCelticCentral AmericanCentral American IndianCherokeeCheyenneChickasawChileanChineseChippewaChoctawColombianColvilleComancheCosta RicanCreeCreekCroatianCrowCubanCypriotCzechCzechoslovakianDanishDelawareDominicanDutchDutch West IndianEastern EuropeanEcuadorianEgyptianEnglishEstonianEthiopianEuropeanFijianFilipinoFinnishFrenchFrench American IndianFrench CanadianGermanGerman RussianGhanaianGreekGuamanian/ChamorroGuatemalanGuyaneseHaitianHmongHonduranHopiHoumaHungarianIcelanderIndian (Asian)IndonesianInupiatIranianIraqiIrishIroquoisIsraeliItalianJamaicanJapaneseJordanianKenyanKiowaKoreanLaotianLatvianLebaneseLiberianLithuanianLumbeeLuxembourgerMacedonianMalaysianMalteseMarshalleseMenomineeMexicanMexican American IndianMongolianMoroccanNative HawaiianNavajoNepaleseNew ZealanderNicaraguanNigerianNorthern EuropeanNorwegianOkinawanOsageOttawaPaiutePakistaniPalestinianPanamanianParaguayanPennsylvania GermanPeruvianPimaPolishPortuguesePotawatomiPuebloPuerto RicanPuget Sound SalishRomanianRussianSalvadoranSamoanScandinavianScotch-IrishScottishSeminoleSenegaleseSerbianShoshoneSierra LeoneanSiouxSlavicSlovakSloveneSomaliSouth AfricanSouth AmericanSouth American IndianSoviet UnionSpaniardSpanishSpanish AmericanSpanish American IndianSri LankanSubsaharan AfricanSudaneseSwedishSwissSyrianTaiwaneseThaiTlingit-HaidaTohono O'OdhamTonganTrinidadian and TobagonianTsimshianTurkishU.S. Virgin IslanderUgandanUkrainianUruguayanUteVenezuelanVietnameseWelshWest IndianYakamaYaquiYugoslavianYumanYup'ikZimbabwean
Immigration
NonimmigrantsImmigrantsAfghanistanAfricaAlbaniaArgentinaArmeniaAsiaAustraliaAustriaBahamasBangladeshBarbadosBelarusBelgiumBelizeBoliviaBosnia and HerzegovinaBrazilBulgariaBurma/MyanmarCabo VerdeCambodiaCameroonCanadaCaribbeanCentral AmericaChileChinaColombiaCongoCosta RicaCroatiaCubaCzechoslovakiaDenmarkDominicaDominican RepublicEastern AfricaEastern AsiaEastern EuropeEcuadorEgyptEl SalvadorEnglandEritreaEthiopiaEuropeFijiFranceGermanyGhanaGreeceGrenadaGuatemalaGuyanaHaitiHondurasHong KongHungaryIndiaIndonesiaIranIraqIrelandIsraelItalyJamaicaJapanJordanKazakhstanKenyaKoreaKuwaitLaosLatin AmericaLatviaLebanonLiberiaLithuaniaMalaysiaMexicoMicronesiaMiddle AfricaMoldovaMoroccoNepalNetherlandsNicaraguaNigeriaNorth AmericaNorth MacedoniaNorthern AfricaNorthern EuropeNorwayOceaniaPakistanPanamaPeruPhilippinesPolandPortugalRomaniaRussiaSaudi ArabiaScotlandSenegalSerbiaSierra LeoneSingaporeSomaliaSouth AfricaSouth AmericaSouth Central AsiaSouth Eastern AsiaSouthern EuropeSpainSri LankaSt. Vincent and the GrenadinesSudanSwedenSwitzerlandSyriaTaiwanThailandTrinidad and TobagoTurkeyUgandaUkraineUruguayUzbekistanVenezuelaVietnamWest IndiesWestern AfricaWestern AsiaWestern EuropeYemenZaireZimbabweAzores
Afghan
Race
Ancestry
AfghanAfricanAlaska NativeAlaskan AthabascanAlbanianAleutAlsatianAmericanApacheArabArapahoArgentineanArmenianAssyrian/Chaldean/SyriacAustralianAustrianBangladeshiBarbadianBasqueBelgianBelizeanBermudanBhutaneseBlackfeetBolivianBrazilianBritishBritish West IndianBulgarianBurmeseCajunCambodianCanadianCape VerdeanCarpatho RusynCelticCentral AmericanCentral American IndianCherokeeCheyenneChickasawChileanChineseChippewaChoctawColombianColvilleComancheCosta RicanCreeCreekCroatianCrowCubanCypriotCzechCzechoslovakianDanishDelawareDominicanDutchDutch West IndianEastern EuropeanEcuadorianEgyptianEnglishEstonianEthiopianEuropeanFijianFilipinoFinnishFrenchFrench American IndianFrench CanadianGermanGerman RussianGhanaianGreekGuamanian/ChamorroGuatemalanGuyaneseHaitianHmongHonduranHopiHoumaHungarianIcelanderIndian (Asian)IndonesianInupiatIranianIraqiIrishIroquoisIsraeliItalianJamaicanJapaneseJordanianKenyanKiowaKoreanLaotianLatvianLebaneseLiberianLithuanianLumbeeLuxembourgerMacedonianMalaysianMalteseMarshalleseMenomineeMexicanMexican American IndianMongolianMoroccanNative HawaiianNavajoNepaleseNew ZealanderNicaraguanNigerianNorthern EuropeanNorwegianOkinawanOsageOttawaPaiutePakistaniPalestinianPanamanianParaguayanPennsylvania GermanPeruvianPimaPolishPortuguesePotawatomiPuebloPuerto RicanPuget Sound SalishRomanianRussianSalvadoranSamoanScandinavianScotch-IrishScottishSeminoleSenegaleseSerbianShoshoneSierra LeoneanSiouxSlavicSlovakSloveneSomaliSouth AfricanSouth AmericanSouth American IndianSoviet UnionSpaniardSpanishSpanish AmericanSpanish American IndianSri LankanSubsaharan AfricanSudaneseSwedishSwissSyrianTaiwaneseThaiTlingit-HaidaTohono O'OdhamTonganTrinidadian and TobagonianTsimshianTurkishU.S. Virgin IslanderUgandanUkrainianUruguayanUteVenezuelanVietnameseWelshWest IndianYakamaYaquiYugoslavianYumanYup'ikZimbabwean
Immigration
NonimmigrantsImmigrantsAfghanistanAfricaAlbaniaArgentinaArmeniaAsiaAustraliaAustriaBahamasBangladeshBarbadosBelarusBelgiumBelizeBoliviaBosnia and HerzegovinaBrazilBulgariaBurma/MyanmarCabo VerdeCambodiaCameroonCanadaCaribbeanCentral AmericaChileChinaColombiaCongoCosta RicaCroatiaCubaCzechoslovakiaDenmarkDominicaDominican RepublicEastern AfricaEastern AsiaEastern EuropeEcuadorEgyptEl SalvadorEnglandEritreaEthiopiaEuropeFijiFranceGermanyGhanaGreeceGrenadaGuatemalaGuyanaHaitiHondurasHong KongHungaryIndiaIndonesiaIranIraqIrelandIsraelItalyJamaicaJapanJordanKazakhstanKenyaKoreaKuwaitLaosLatin AmericaLatviaLebanonLiberiaLithuaniaMalaysiaMexicoMicronesiaMiddle AfricaMoldovaMoroccoNepalNetherlandsNicaraguaNigeriaNorth AmericaNorth MacedoniaNorthern AfricaNorthern EuropeNorwayOceaniaPakistanPanamaPeruPhilippinesPolandPortugalRomaniaRussiaSaudi ArabiaScotlandSenegalSerbiaSierra LeoneSingaporeSomaliaSouth AfricaSouth AmericaSouth Central AsiaSouth Eastern AsiaSouthern EuropeSpainSri LankaSt. Vincent and the GrenadinesSudanSwedenSwitzerlandSyriaTaiwanThailandTrinidad and TobagoTurkeyUgandaUkraineUruguayUzbekistanVenezuelaVietnamWest IndiesWestern AfricaWestern AsiaWestern EuropeYemenZaireZimbabweAzores
High School Diploma
Income
Poverty
Unemployment
Labor Participation
Family Structure
Vehicle Availability
Education Level
Disability

High School Diploma Comparison

Bahamians

Afghans

Tragic
Fair
87.5%
HIGH SCHOOL DIPLOMA
0.7/ 100
METRIC RATING
257th/ 347
METRIC RANK
88.8%
HIGH SCHOOL DIPLOMA
23.9/ 100
METRIC RATING
195th/ 347
METRIC RANK

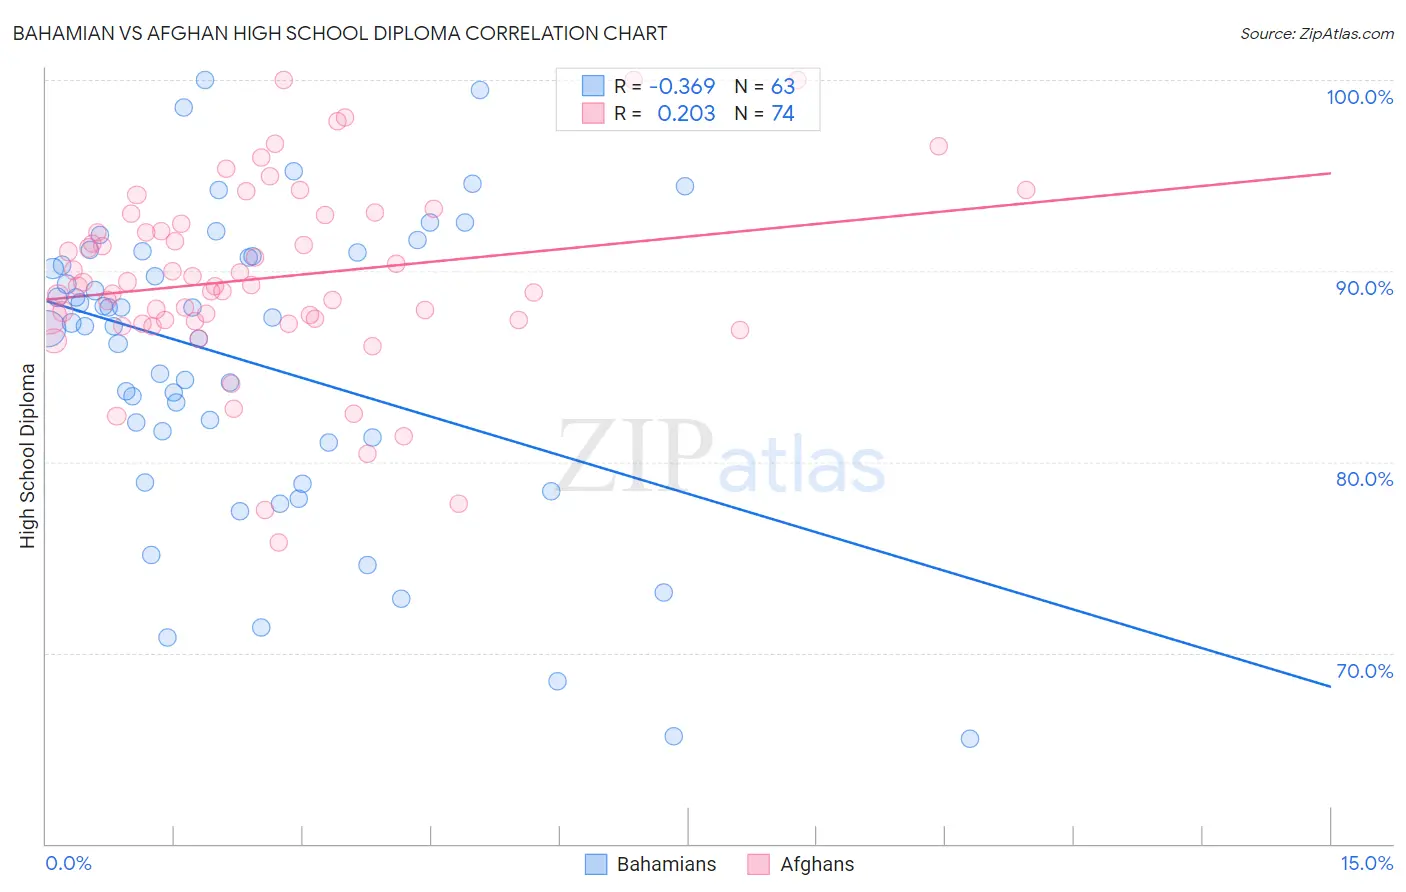
Bahamian vs Afghan High School Diploma Correlation Chart

The statistical analysis conducted on geographies consisting of 112,698,819 people shows a mild negative correlation between the proportion of Bahamians and percentage of population with at least high school diploma education in the United States with a correlation coefficient (R) of -0.369 and weighted average of 87.5%. Similarly, the statistical analysis conducted on geographies consisting of 148,851,685 people shows a weak positive correlation between the proportion of Afghans and percentage of population with at least high school diploma education in the United States with a correlation coefficient (R) of 0.203 and weighted average of 88.8%, a difference of 1.5%.
Bahamian vs Afghan High School Diploma

High School Diploma Correlation Summary

MeasurementBahamianAfghan
Minimum65.5%75.7%
Maximum100.0%100.0%
Range34.5%24.3%
Mean85.2%89.6%
Median87.1%89.2%
Interquartile 25% (IQ1)81.0%87.4%
Interquartile 75% (IQ3)90.8%92.4%
Interquartile Range (IQR)9.8%5.0%
Standard Deviation (Sample)7.9%4.9%
Standard Deviation (Population)7.9%4.9%

Similar Demographics by High School Diploma

Demographics Similar to Bahamians by High School Diploma

In terms of high school diploma, the demographic groups most similar to Bahamians are African (87.5%, a difference of 0.0%), Immigrants from Senegal (87.6%, a difference of 0.10%), Immigrants from Ghana (87.4%, a difference of 0.10%), Immigrants from Western Africa (87.4%, a difference of 0.11%), and Immigrants from Colombia (87.6%, a difference of 0.16%).
DemographicsRating | RankHigh School Diploma
Immigrants | Nigeria
1.5
/100
|
#250
Tragic
87.7%
Ghanaians
1.4
/100
|
#251
Tragic
87.7%
Immigrants | South America
1.2
/100
|
#252
Tragic
87.6%
Immigrants | Uruguay
1.0
/100
|
#253
Tragic
87.6%
Immigrants | Colombia
1.0
/100
|
#254
Tragic
87.6%
Immigrants | Senegal
0.9
/100
|
#255
Tragic
87.6%
Africans
0.7
/100
|
#256
Tragic
87.5%
Bahamians
0.7
/100
|
#257
Tragic
87.5%
Immigrants | Ghana
0.5
/100
|
#258
Tragic
87.4%
Immigrants | Western Africa
0.5
/100
|
#259
Tragic
87.4%
Cajuns
0.4
/100
|
#260
Tragic
87.3%
Seminole
0.4
/100
|
#261
Tragic
87.3%
Immigrants | Peru
0.4
/100
|
#262
Tragic
87.3%
Immigrants | South Eastern Asia
0.3
/100
|
#263
Tragic
87.2%
Jamaicans
0.3
/100
|
#264
Tragic
87.2%

Demographics Similar to Afghans by High School Diploma

In terms of high school diploma, the demographic groups most similar to Afghans are Immigrants from Southern Europe (88.7%, a difference of 0.010%), Immigrants from Venezuela (88.8%, a difference of 0.040%), French American Indian (88.7%, a difference of 0.050%), Immigrants from Oceania (88.8%, a difference of 0.060%), and Moroccan (88.8%, a difference of 0.11%).
DemographicsRating | RankHigh School Diploma
Immigrants | Sudan
33.4
/100
|
#188
Fair
88.9%
Immigrants | Uganda
32.6
/100
|
#189
Fair
88.9%
Immigrants | Chile
31.9
/100
|
#190
Fair
88.9%
Immigrants | Ethiopia
30.9
/100
|
#191
Fair
88.9%
Moroccans
29.5
/100
|
#192
Fair
88.8%
Immigrants | Oceania
26.9
/100
|
#193
Fair
88.8%
Immigrants | Venezuela
25.8
/100
|
#194
Fair
88.8%
Afghans
23.9
/100
|
#195
Fair
88.8%
Immigrants | Southern Europe
23.4
/100
|
#196
Fair
88.7%
French American Indians
21.5
/100
|
#197
Fair
88.7%
Liberians
18.8
/100
|
#198
Poor
88.7%
Marshallese
18.7
/100
|
#199
Poor
88.6%
Hawaiians
18.3
/100
|
#200
Poor
88.6%
Koreans
18.1
/100
|
#201
Poor
88.6%
Panamanians
18.0
/100
|
#202
Poor
88.6%