Austrian vs Immigrants from Western Africa 10th Grade
COMPARE
Austrian
Immigrants from Western Africa
10th Grade
10th Grade Comparison
Austrians
Immigrants from Western Africa
95.1%
10TH GRADE
99.8/ 100
METRIC RATING
51st/ 347
METRIC RANK
92.5%
10TH GRADE
0.3/ 100
METRIC RATING
272nd/ 347
METRIC RANK
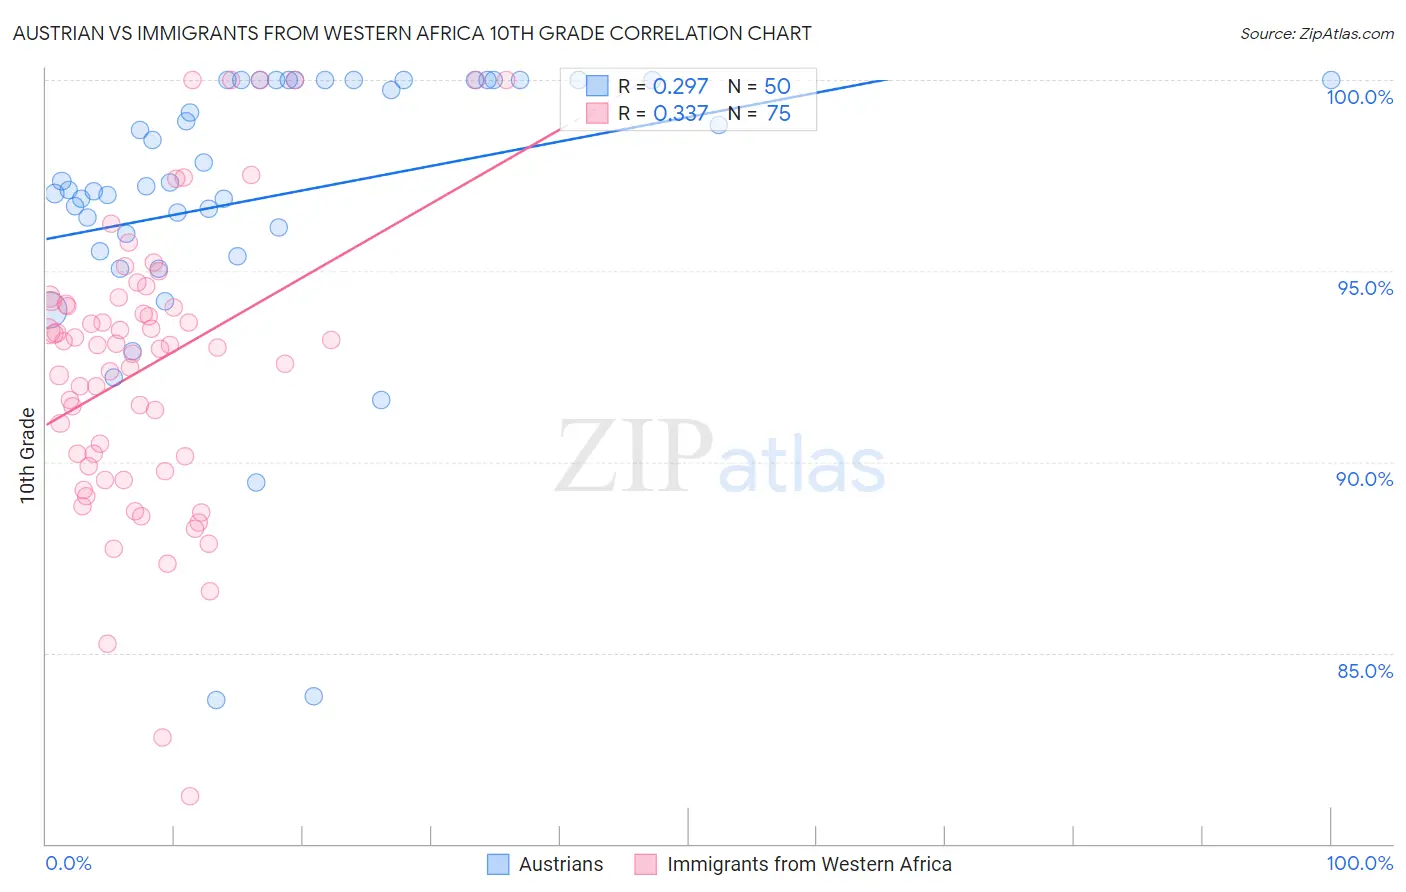
Austrian vs Immigrants from Western Africa 10th Grade Correlation Chart
The statistical analysis conducted on geographies consisting of 452,082,820 people shows a weak positive correlation between the proportion of Austrians and percentage of population with at least 10th grade education in the United States with a correlation coefficient (R) of 0.297 and weighted average of 95.1%. Similarly, the statistical analysis conducted on geographies consisting of 357,883,667 people shows a mild positive correlation between the proportion of Immigrants from Western Africa and percentage of population with at least 10th grade education in the United States with a correlation coefficient (R) of 0.337 and weighted average of 92.5%, a difference of 2.8%.
10th Grade Correlation Summary
| Measurement | Austrian | Immigrants from Western Africa |
| Minimum | 83.8% | 81.2% |
| Maximum | 100.0% | 100.0% |
| Range | 16.2% | 18.8% |
| Mean | 96.9% | 92.5% |
| Median | 97.3% | 93.1% |
| Interquartile 25% (IQ1) | 96.0% | 89.9% |
| Interquartile 75% (IQ3) | 100.0% | 94.2% |
| Interquartile Range (IQR) | 4.0% | 4.3% |
| Standard Deviation (Sample) | 3.7% | 3.8% |
| Standard Deviation (Population) | 3.7% | 3.7% |
Similar Demographics by 10th Grade
Demographics Similar to Austrians by 10th Grade
In terms of 10th grade, the demographic groups most similar to Austrians are Ottawa (95.1%, a difference of 0.0%), Immigrants from Canada (95.1%, a difference of 0.010%), Immigrants from North America (95.0%, a difference of 0.010%), Immigrants from Austria (95.1%, a difference of 0.030%), and Immigrants from Lithuania (95.0%, a difference of 0.030%).
| Demographics | Rating | Rank | 10th Grade |
| Immigrants | Northern Europe | 99.9 /100 | #44 | Exceptional 95.2% |
| Greeks | 99.9 /100 | #45 | Exceptional 95.2% |
| Czechoslovakians | 99.9 /100 | #46 | Exceptional 95.1% |
| Serbians | 99.9 /100 | #47 | Exceptional 95.1% |
| Australians | 99.9 /100 | #48 | Exceptional 95.1% |
| Immigrants | Austria | 99.9 /100 | #49 | Exceptional 95.1% |
| Immigrants | Canada | 99.8 /100 | #50 | Exceptional 95.1% |
| Austrians | 99.8 /100 | #51 | Exceptional 95.1% |
| Ottawa | 99.8 /100 | #52 | Exceptional 95.1% |
| Immigrants | North America | 99.8 /100 | #53 | Exceptional 95.0% |
| Immigrants | Lithuania | 99.8 /100 | #54 | Exceptional 95.0% |
| Immigrants | Ireland | 99.8 /100 | #55 | Exceptional 95.0% |
| New Zealanders | 99.8 /100 | #56 | Exceptional 95.0% |
| Ukrainians | 99.8 /100 | #57 | Exceptional 95.0% |
| Aleuts | 99.8 /100 | #58 | Exceptional 95.0% |
Demographics Similar to Immigrants from Western Africa by 10th Grade
In terms of 10th grade, the demographic groups most similar to Immigrants from Western Africa are Immigrants from Eritrea (92.5%, a difference of 0.010%), Immigrants from Colombia (92.5%, a difference of 0.020%), Immigrants from Uruguay (92.5%, a difference of 0.020%), Taiwanese (92.5%, a difference of 0.040%), and Immigrants from Ghana (92.5%, a difference of 0.040%).
| Demographics | Rating | Rank | 10th Grade |
| Dutch West Indians | 0.4 /100 | #265 | Tragic 92.6% |
| Immigrants | Philippines | 0.4 /100 | #266 | Tragic 92.6% |
| Taiwanese | 0.3 /100 | #267 | Tragic 92.5% |
| Immigrants | Ghana | 0.3 /100 | #268 | Tragic 92.5% |
| Immigrants | Colombia | 0.3 /100 | #269 | Tragic 92.5% |
| Immigrants | Uruguay | 0.3 /100 | #270 | Tragic 92.5% |
| Immigrants | Eritrea | 0.3 /100 | #271 | Tragic 92.5% |
| Immigrants | Western Africa | 0.3 /100 | #272 | Tragic 92.5% |
| Trinidadians and Tobagonians | 0.2 /100 | #273 | Tragic 92.4% |
| Immigrants | Congo | 0.2 /100 | #274 | Tragic 92.4% |
| West Indians | 0.2 /100 | #275 | Tragic 92.4% |
| Immigrants | Trinidad and Tobago | 0.1 /100 | #276 | Tragic 92.3% |
| Navajo | 0.1 /100 | #277 | Tragic 92.3% |
| Barbadians | 0.1 /100 | #278 | Tragic 92.2% |
| Natives/Alaskans | 0.1 /100 | #279 | Tragic 92.2% |