Austrian vs Immigrants from Korea 3rd Grade

COMPARE

Austrian
Race
Ancestry
AfghanAfricanAlaska NativeAlaskan AthabascanAlbanianAleutAlsatianAmericanApacheArabArapahoArgentineanArmenianAssyrian/Chaldean/SyriacAustralianAustrianBahamianBangladeshiBarbadianBasqueBelgianBelizeanBermudanBhutaneseBlackfeetBolivianBrazilianBritishBritish West IndianBulgarianBurmeseCajunCambodianCanadianCape VerdeanCarpatho RusynCelticCentral AmericanCentral American IndianCherokeeCheyenneChickasawChileanChineseChippewaChoctawColombianColvilleComancheCosta RicanCreeCreekCroatianCrowCubanCypriotCzechCzechoslovakianDanishDelawareDominicanDutchDutch West IndianEastern EuropeanEcuadorianEgyptianEnglishEstonianEthiopianEuropeanFijianFilipinoFinnishFrenchFrench American IndianFrench CanadianGermanGerman RussianGhanaianGreekGuamanian/ChamorroGuatemalanGuyaneseHaitianHmongHonduranHopiHoumaHungarianIcelanderIndian (Asian)IndonesianInupiatIranianIraqiIrishIroquoisIsraeliItalianJamaicanJapaneseJordanianKenyanKiowaKoreanLaotianLatvianLebaneseLiberianLithuanianLumbeeLuxembourgerMacedonianMalaysianMalteseMarshalleseMenomineeMexicanMexican American IndianMongolianMoroccanNative HawaiianNavajoNepaleseNew ZealanderNicaraguanNigerianNorthern EuropeanNorwegianOkinawanOsageOttawaPaiutePakistaniPalestinianPanamanianParaguayanPennsylvania GermanPeruvianPimaPolishPortuguesePotawatomiPuebloPuerto RicanPuget Sound SalishRomanianRussianSalvadoranSamoanScandinavianScotch-IrishScottishSeminoleSenegaleseSerbianShoshoneSierra LeoneanSiouxSlavicSlovakSloveneSomaliSouth AfricanSouth AmericanSouth American IndianSoviet UnionSpaniardSpanishSpanish AmericanSpanish American IndianSri LankanSubsaharan AfricanSudaneseSwedishSwissSyrianTaiwaneseThaiTlingit-HaidaTohono O'OdhamTonganTrinidadian and TobagonianTsimshianTurkishU.S. Virgin IslanderUgandanUkrainianUruguayanUteVenezuelanVietnameseWelshWest IndianYakamaYaquiYugoslavianYumanYup'ikZimbabwean
Immigration
NonimmigrantsImmigrantsAfghanistanAfricaAlbaniaArgentinaArmeniaAsiaAustraliaAustriaBahamasBangladeshBarbadosBelarusBelgiumBelizeBoliviaBosnia and HerzegovinaBrazilBulgariaBurma/MyanmarCabo VerdeCambodiaCameroonCanadaCaribbeanCentral AmericaChileChinaColombiaCongoCosta RicaCroatiaCubaCzechoslovakiaDenmarkDominicaDominican RepublicEastern AfricaEastern AsiaEastern EuropeEcuadorEgyptEl SalvadorEnglandEritreaEthiopiaEuropeFijiFranceGermanyGhanaGreeceGrenadaGuatemalaGuyanaHaitiHondurasHong KongHungaryIndiaIndonesiaIranIraqIrelandIsraelItalyJamaicaJapanJordanKazakhstanKenyaKuwaitLaosLatin AmericaLatviaLebanonLiberiaLithuaniaMalaysiaMexicoMicronesiaMiddle AfricaMoldovaMoroccoNepalNetherlandsNicaraguaNigeriaNorth AmericaNorth MacedoniaNorthern AfricaNorthern EuropeNorwayOceaniaPakistanPanamaPeruPhilippinesPolandPortugalRomaniaRussiaSaudi ArabiaScotlandSenegalSerbiaSierra LeoneSingaporeSomaliaSouth AfricaSouth AmericaSouth Central AsiaSouth Eastern AsiaSouthern EuropeSpainSri LankaSt. Vincent and the GrenadinesSudanSwedenSwitzerlandSyriaTaiwanThailandTrinidad and TobagoTurkeyUgandaUkraineUruguayUzbekistanVenezuelaVietnamWest IndiesWestern AfricaWestern AsiaWestern EuropeYemenZaireZimbabweAzores
Immigrants from Korea
Race
Ancestry
AfghanAfricanAlaska NativeAlaskan AthabascanAlbanianAleutAlsatianAmericanApacheArabArapahoArgentineanArmenianAssyrian/Chaldean/SyriacAustralianBahamianBangladeshiBarbadianBasqueBelgianBelizeanBermudanBhutaneseBlackfeetBolivianBrazilianBritishBritish West IndianBulgarianBurmeseCajunCambodianCanadianCape VerdeanCarpatho RusynCelticCentral AmericanCentral American IndianCherokeeCheyenneChickasawChileanChineseChippewaChoctawColombianColvilleComancheCosta RicanCreeCreekCroatianCrowCubanCypriotCzechCzechoslovakianDanishDelawareDominicanDutchDutch West IndianEastern EuropeanEcuadorianEgyptianEnglishEstonianEthiopianEuropeanFijianFilipinoFinnishFrenchFrench American IndianFrench CanadianGermanGerman RussianGhanaianGreekGuamanian/ChamorroGuatemalanGuyaneseHaitianHmongHonduranHopiHoumaHungarianIcelanderIndian (Asian)IndonesianInupiatIranianIraqiIrishIroquoisIsraeliItalianJamaicanJapaneseJordanianKenyanKiowaKoreanLaotianLatvianLebaneseLiberianLithuanianLumbeeLuxembourgerMacedonianMalaysianMalteseMarshalleseMenomineeMexicanMexican American IndianMongolianMoroccanNative HawaiianNavajoNepaleseNew ZealanderNicaraguanNigerianNorthern EuropeanNorwegianOkinawanOsageOttawaPaiutePakistaniPalestinianPanamanianParaguayanPennsylvania GermanPeruvianPimaPolishPortuguesePotawatomiPuebloPuerto RicanPuget Sound SalishRomanianRussianSalvadoranSamoanScandinavianScotch-IrishScottishSeminoleSenegaleseSerbianShoshoneSierra LeoneanSiouxSlavicSlovakSloveneSomaliSouth AfricanSouth AmericanSouth American IndianSoviet UnionSpaniardSpanishSpanish AmericanSpanish American IndianSri LankanSubsaharan AfricanSudaneseSwedishSwissSyrianTaiwaneseThaiTlingit-HaidaTohono O'OdhamTonganTrinidadian and TobagonianTsimshianTurkishU.S. Virgin IslanderUgandanUkrainianUruguayanUteVenezuelanVietnameseWelshWest IndianYakamaYaquiYugoslavianYumanYup'ikZimbabwean
Immigration
NonimmigrantsImmigrantsAfghanistanAfricaAlbaniaArgentinaArmeniaAsiaAustraliaAustriaBahamasBangladeshBarbadosBelarusBelgiumBelizeBoliviaBosnia and HerzegovinaBrazilBulgariaBurma/MyanmarCabo VerdeCambodiaCameroonCanadaCaribbeanCentral AmericaChileChinaColombiaCongoCosta RicaCroatiaCubaCzechoslovakiaDenmarkDominicaDominican RepublicEastern AfricaEastern AsiaEastern EuropeEcuadorEgyptEl SalvadorEnglandEritreaEthiopiaEuropeFijiFranceGermanyGhanaGreeceGrenadaGuatemalaGuyanaHaitiHondurasHong KongHungaryIndiaIndonesiaIranIraqIrelandIsraelItalyJamaicaJapanJordanKazakhstanKenyaKoreaKuwaitLaosLatin AmericaLatviaLebanonLiberiaLithuaniaMalaysiaMexicoMicronesiaMiddle AfricaMoldovaMoroccoNepalNetherlandsNicaraguaNigeriaNorth AmericaNorth MacedoniaNorthern AfricaNorthern EuropeNorwayOceaniaPakistanPanamaPeruPhilippinesPolandPortugalRomaniaRussiaSaudi ArabiaScotlandSenegalSerbiaSierra LeoneSingaporeSomaliaSouth AfricaSouth AmericaSouth Central AsiaSouth Eastern AsiaSouthern EuropeSpainSri LankaSt. Vincent and the GrenadinesSudanSwedenSwitzerlandSyriaTaiwanThailandTrinidad and TobagoTurkeyUgandaUkraineUruguayUzbekistanVenezuelaVietnamWest IndiesWestern AfricaWestern AsiaWestern EuropeYemenZaireZimbabweAzores
3rd Grade
Income
Poverty
Unemployment
Labor Participation
Family Structure
Vehicle Availability
Education Level
Disability

3rd Grade Comparison

Austrians

Immigrants from Korea

Exceptional
Average
98.3%
3RD GRADE
99.8/ 100
METRIC RATING
56th/ 347
METRIC RANK
97.8%
3RD GRADE
50.9/ 100
METRIC RATING
173rd/ 347
METRIC RANK

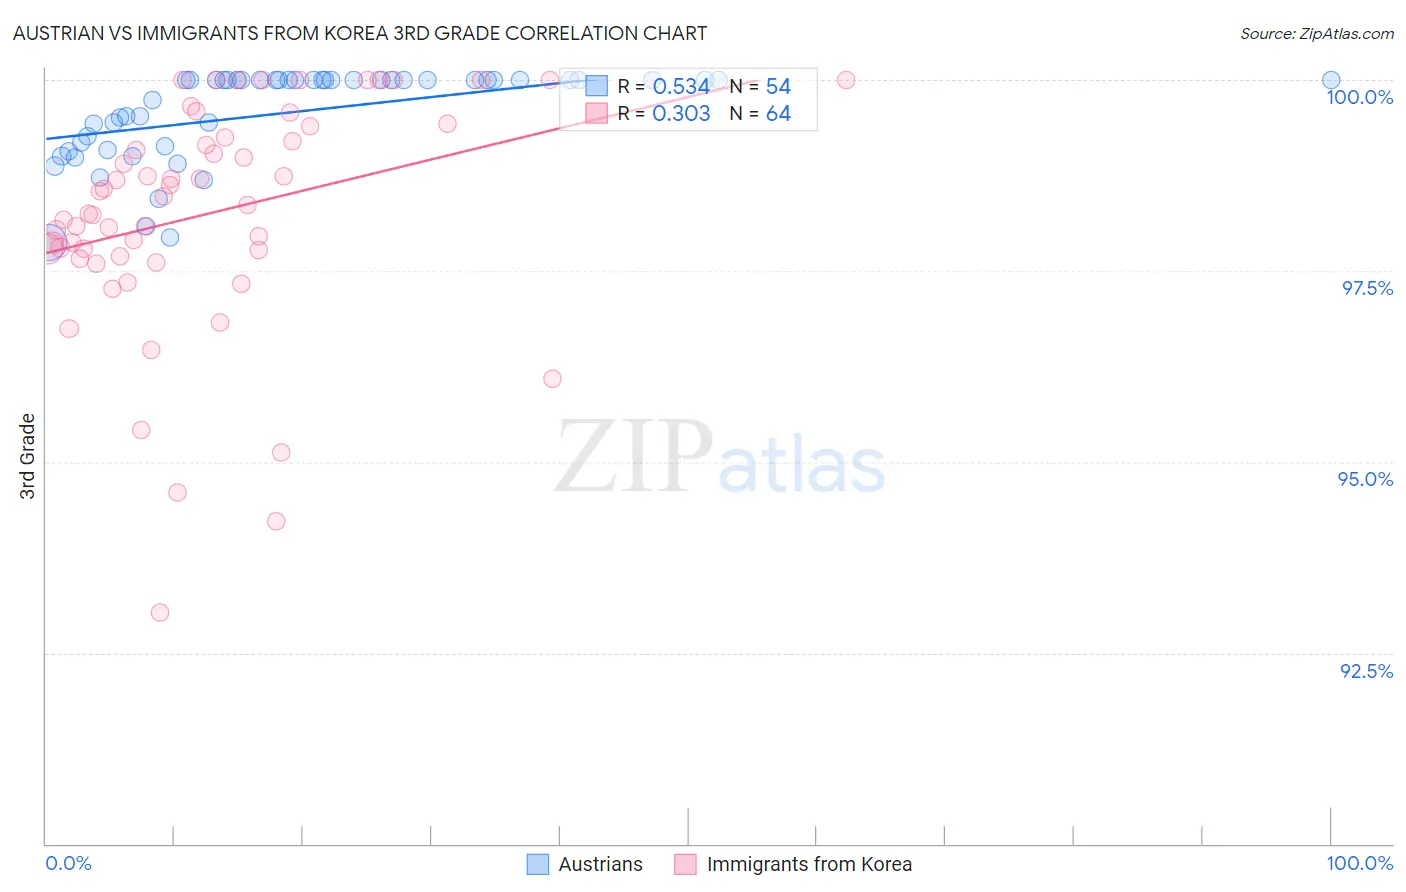
Austrian vs Immigrants from Korea 3rd Grade Correlation Chart

The statistical analysis conducted on geographies consisting of 452,080,536 people shows a substantial positive correlation between the proportion of Austrians and percentage of population with at least 3rd grade education in the United States with a correlation coefficient (R) of 0.534 and weighted average of 98.3%. Similarly, the statistical analysis conducted on geographies consisting of 416,280,076 people shows a mild positive correlation between the proportion of Immigrants from Korea and percentage of population with at least 3rd grade education in the United States with a correlation coefficient (R) of 0.303 and weighted average of 97.8%, a difference of 0.51%.
Austrian vs Immigrants from Korea 3rd Grade

3rd Grade Correlation Summary

MeasurementAustrianImmigrants from Korea
Minimum97.9%93.0%
Maximum100.0%100.0%
Range2.1%7.0%
Mean99.6%98.3%
Median100.0%98.4%
Interquartile 25% (IQ1)99.1%97.7%
Interquartile 75% (IQ3)100.0%99.3%
Interquartile Range (IQR)0.86%1.6%
Standard Deviation (Sample)0.60%1.5%
Standard Deviation (Population)0.60%1.5%

Similar Demographics by 3rd Grade

Demographics Similar to Austrians by 3rd Grade

In terms of 3rd grade, the demographic groups most similar to Austrians are Bulgarian (98.3%, a difference of 0.0%), American (98.3%, a difference of 0.0%), Slavic (98.3%, a difference of 0.0%), Immigrants from Scotland (98.3%, a difference of 0.010%), and Greek (98.3%, a difference of 0.010%).
DemographicsRating | Rank3rd Grade
Estonians
99.8
/100
|
#49
Exceptional
98.3%
Celtics
99.8
/100
|
#50
Exceptional
98.3%
Australians
99.8
/100
|
#51
Exceptional
98.3%
Whites/Caucasians
99.8
/100
|
#52
Exceptional
98.3%
Immigrants | Scotland
99.8
/100
|
#53
Exceptional
98.3%
Bulgarians
99.8
/100
|
#54
Exceptional
98.3%
Americans
99.8
/100
|
#55
Exceptional
98.3%
Austrians
99.8
/100
|
#56
Exceptional
98.3%
Slavs
99.7
/100
|
#57
Exceptional
98.3%
Greeks
99.7
/100
|
#58
Exceptional
98.3%
Maltese
99.7
/100
|
#59
Exceptional
98.3%
Creek
99.7
/100
|
#60
Exceptional
98.2%
Pueblo
99.7
/100
|
#61
Exceptional
98.2%
Immigrants | Canada
99.7
/100
|
#62
Exceptional
98.2%
Immigrants | North America
99.7
/100
|
#63
Exceptional
98.2%

Demographics Similar to Immigrants from Korea by 3rd Grade

In terms of 3rd grade, the demographic groups most similar to Immigrants from Korea are Kenyan (97.8%, a difference of 0.0%), Spanish American (97.8%, a difference of 0.0%), Navajo (97.8%, a difference of 0.0%), Chilean (97.8%, a difference of 0.010%), and Immigrants from Spain (97.8%, a difference of 0.010%).
DemographicsRating | Rank3rd Grade
Dutch West Indians
55.5
/100
|
#166
Average
97.8%
Chileans
55.3
/100
|
#167
Average
97.8%
Immigrants | Spain
54.3
/100
|
#168
Average
97.8%
Comanche
53.8
/100
|
#169
Average
97.8%
Brazilians
53.7
/100
|
#170
Average
97.8%
Kenyans
51.8
/100
|
#171
Average
97.8%
Spanish Americans
51.8
/100
|
#172
Average
97.8%
Immigrants | Korea
50.9
/100
|
#173
Average
97.8%
Navajo
50.0
/100
|
#174
Average
97.8%
Immigrants | Micronesia
47.6
/100
|
#175
Average
97.8%
Immigrants | Poland
47.1
/100
|
#176
Average
97.8%
Egyptians
46.6
/100
|
#177
Average
97.7%
Immigrants | Brazil
46.4
/100
|
#178
Average
97.7%
Immigrants | Belarus
45.9
/100
|
#179
Average
97.7%
Immigrants | Sri Lanka
45.1
/100
|
#180
Average
97.7%